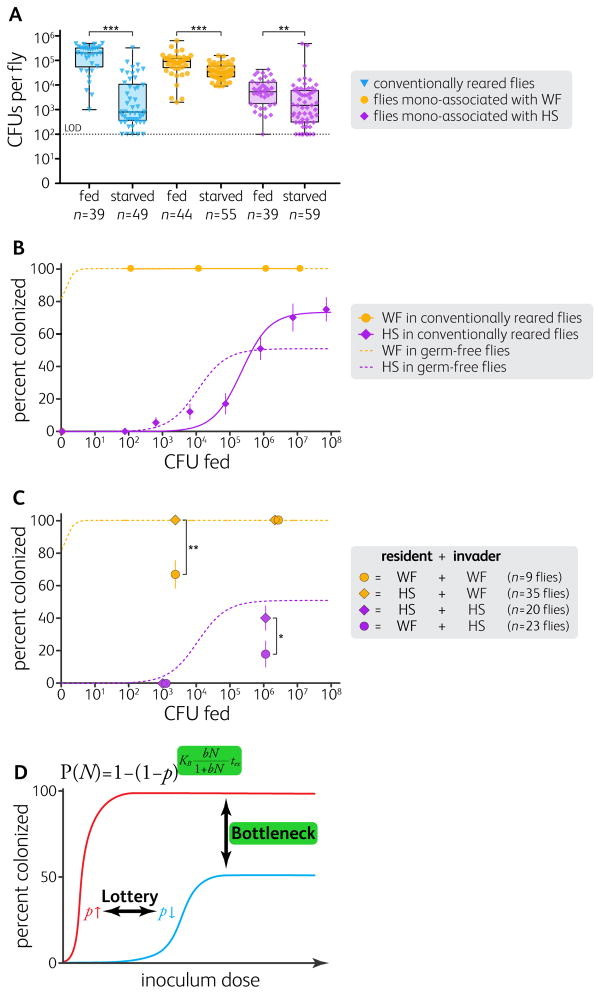
Figure 4. Competition Drives Stability in the Fly Gut Microbiome.
(A) Starvation for 16 to 24 h reduced gut bacterial populations in conventionally reared flies and in WF- or HS-associated flies. Starvation also increased the between-fly variation in conventionally reared and HS-associated flies. Boxes represent the 25th and the 75th percentiles with the median; whiskers represent the range. **p < 0.01, ***p < 0.001, unpaired Welch’s t-test of log-transformed data (Bonferroni-corrected).
(B) HS had a reduced per-cell colonization probability in conventionally reared flies (n = 313 flies; p = 2.6×10⁻⁶; N = 4.9×10⁵), but WF colonization did not change in conventionally reared flies (n = 37 flies). Solid lines are fits of equation (1) to the data in conventionally reared flies.
(C) WF pre-colonization reduced subsequent colonization while HS pre-colonization had no effect on subsequent colonization. Canton-S flies were pre-colonized with WF (circles) or HS (diamonds), then inoculated with a low or a high dose of tagged WF (orange) or tagged HS (purple).
In (B and C), as a point of reference, dashed lines indicate equation 1 fits for germ-free flies shown in Figure 1B. In (B and C), error bars indicate S.E.P. *p < 0.05, **p < 0.01, z-test. LOD = limit of detection.
(D) A lottery model with a bottleneck effect predicts dose-dependent colonization efficiency (equation 1; see also STAR METHODS).

