
Fig. 3.
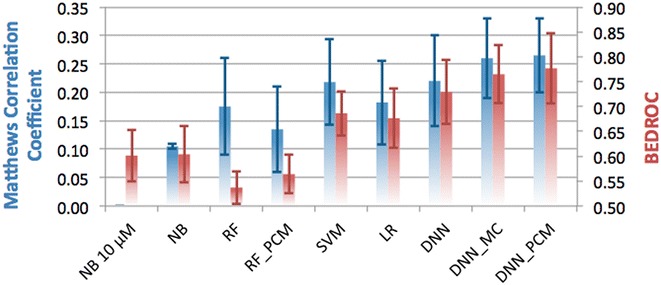
Performance of the different methods in the temporal split validation, grouped by underlying algorithm and colored by metric used. On the left y-axis, and in blue the MCC is shown, while on the right y-axis and in red the BEDROC (α = 20) score is shown. Default, single class algorithms are shown, and for several algorithms the performance of PCM and multi-class implementations is shown. Error bars indicate SEM. Mean MCC is 0.17 (±0.03) and mean BEDROC is 0.66 (±0.03)