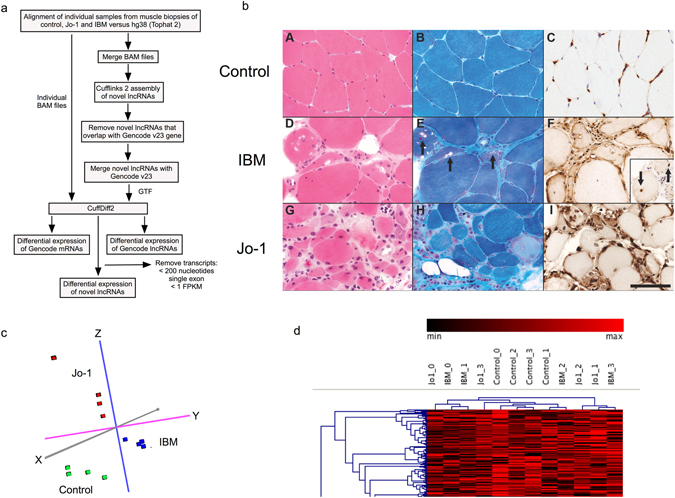
Figure 1.

Muscle biopsy analysis. (a) Description of bioinformatics analysis pathway, (b) Muscle histology where A-C shows normal muscle tissue from one of the controls. D-F shows classical features of IBM in one of the biopsies. G–I are sections from a muscle biopsy from one of the patients with Jo-1 myositis. A,D and G were stained with HE and B,E and H with modified Gomori trichrome. C,F and I were immunolabelled for β2-microglobulin. Inset in F shows inclusions immunolabelled for ubiquitin. The scale bar represents 50 μm, (c) Principle component analysis (PCA) of the mRNA data from control, IBM and Jo-1 myositis, (d) Non-supervised hierarchical cluster analysis of the mRNA data from control, IBM and Jo-1 myositis.
