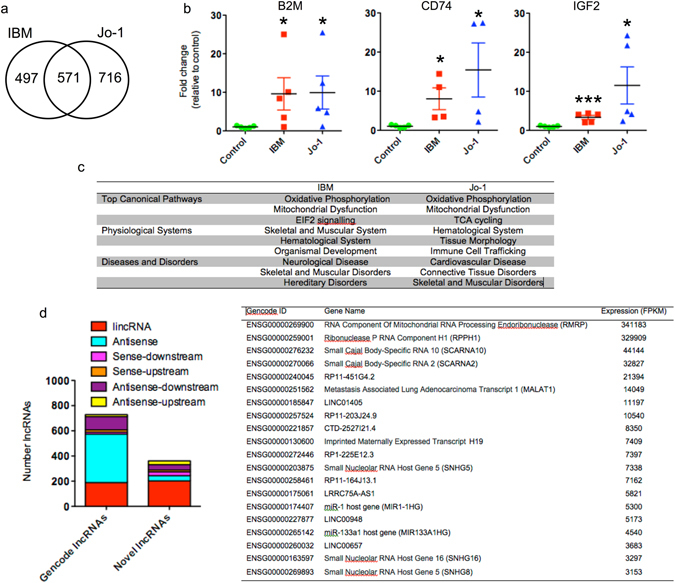
Figure 2.

Analysis of mRNA and lncRNA expression data in control, IBM and Jo-1 myositis. (a) Venn diagram showing overlap between differentially expressed mRNAs in IBM and Jo-1 myositis, (b) Changes in levels of β2-microglobulin (B2M), CD74 and IGF2 mRNA expression were confirmed by qRT-PCR. The data are presented as the mean ± SEM of 4–5 patients where *p < 0.05 and ***p < 0.001 (Mann-Whitney U-test). (c) Pathway analysis of differentially expressed mRNAs in IBM and Jo-1 myositis, (d) Classification of Gencode and novel lncRNA in skeletal muscle and, (e) List of most highly expressed lncRNA in control skeletal muscle.
