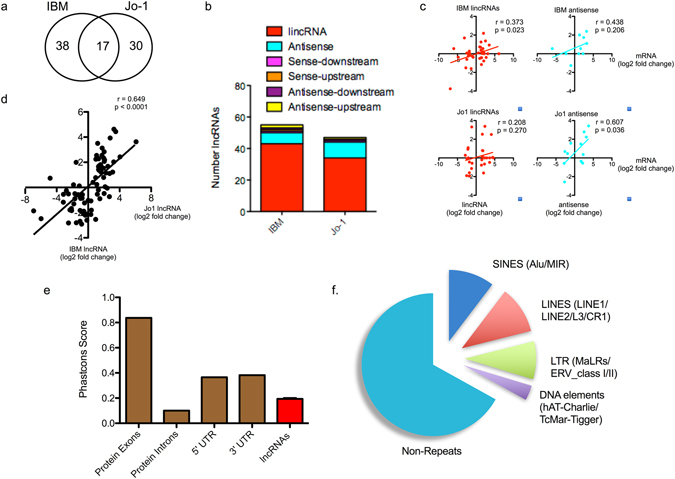
Figure 3.

Characterisation of differentially expressed lncRNAs in control, IBM and Jo-1 myositis. (a) Venn diagram showing overlap between differentially expressed lncRNAs in IBM and Jo-1 myositis, (b) Classification of differentially expressed lncRNAs in IBM and Jo-1 myositis, (c) Correlation between differentially expressed lncRNAs and that of the nearest protein coding mRNA, (d) Correlation between differential lncRNA expression in IBM and Jo-1 myositis, (e) PhastCons analysis of the conservation of the differentially expressed lncRNA species in human and mouse cells compared with the exon, intronic and untranslated regions (UTRs) of protein coding genes and (f) Pie chart showing the % distribution of repeat sequences in the various sub-populations of lncRNAs across all 4 cell types with SINES = short interspersed nuclear elements, LINES = long interspersed nuclear elements and LTR = long terminal repeat.
