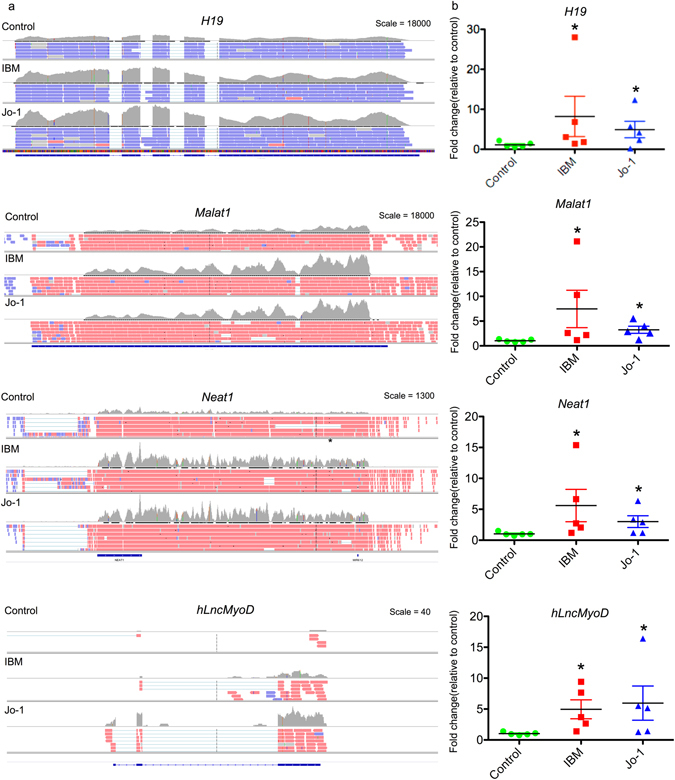
Figure 4.

Differential expression of H19, MALAT1, NEAT1 and hLncMYoD in control, IBM and Jo-1 myositis. (a) View from the Integrated Genome Viewer (IGV) of aligned sequence data for H19, MALAT1, NEAT1 and hLncMYoD. Red and blue blocks represent reads aligned to the positive and negative strand of the DNA, respectively. The dark gray histogram represents the sum of the aligned sequencing reads along the genome, with the scale stated on the top right corner, (b) Changes in levels of H19, MALAT1, NEAT1 and hLncMYoD were confirmed using qRT-PCR the data are the mean ± SEM of 5 patients where *p < 0.05 (Mann-Whitney U-test).
