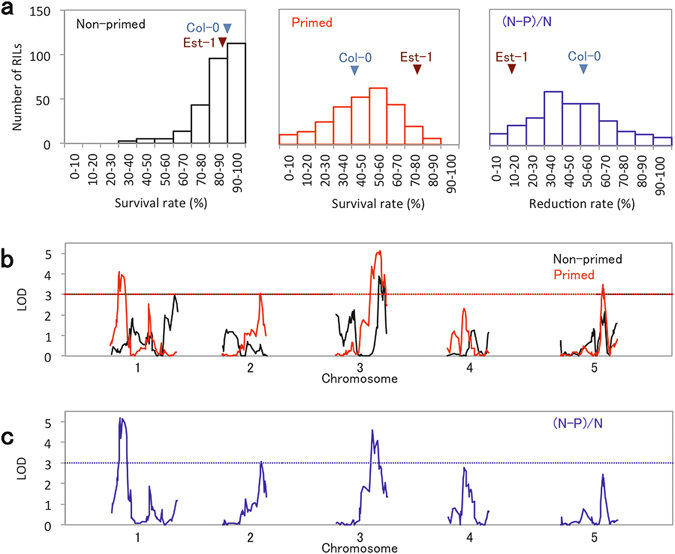
Figure 4.

Identification of QTLs for seed longevity. (a) Frequency distributions of survival rates in 279 RILs before (non-primed; left panel) and after (primed; middle panel) priming after 3 days of CDT. Reduction in survival rates caused by priming are also shown [(N − P)/N; right panel]. (b) QTL mapping of seed longevity determined as survival rates after 3 days of CDT before (non-primed) and after (primed) priming. (c) QTL mapping of seed longevity determined as reduction of survival rates by priming [(N − P)/N]. Dotted lines in (b) and (c) indicate threshold (LOD = 3, P < 0.026 from 10,000-time permutation).
