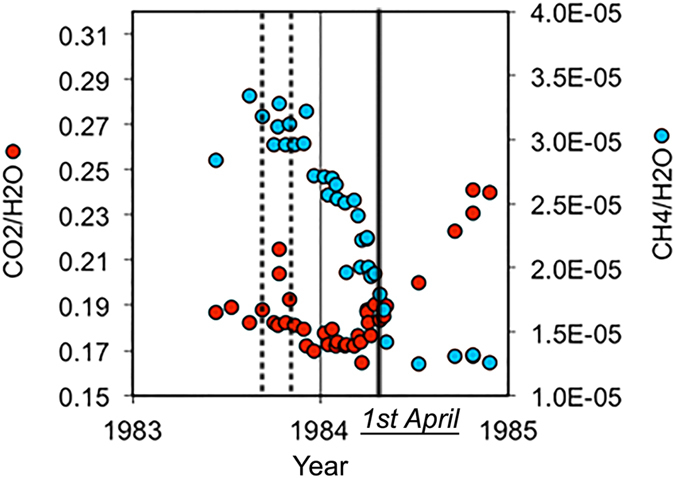
Figure 2.

Geochemical gas composition during unrest. CO 2/H 2 O (left, red dots) and CH 4/H 2 O (right, blue dots) ratios measurements against time. April 1, when the decrease of CH 4/H 2 O stops and the increase of CO 2/H 2 O starts, is marked by a black bar. September-October 1983 (between the vertical dashed lines) corresponds to the period when fluid injections are perturbing the upper hydrothermal system at Solfatara, following the fluid-flow modelling of Chiodini et al.17. The plot is obtained using the plotting functions of Microsoft Excel© for Mac 2011 14.4.9 (https://www.microsoft.com/en-us/download/details.aspx?id=46571).
