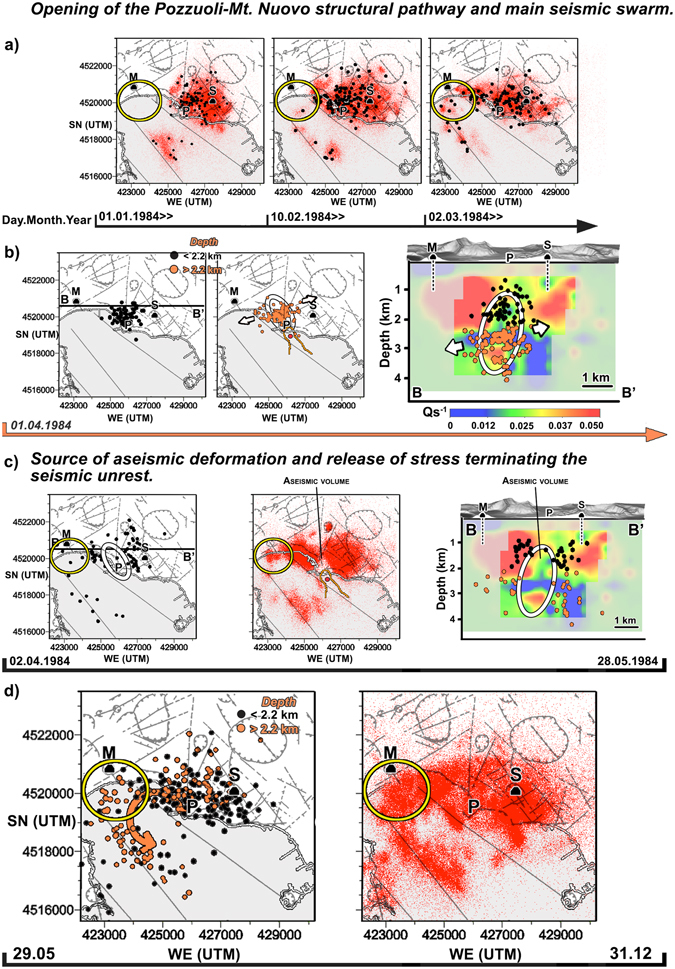
Figure 5.

Time-dependent seismicity during the 1984 unrest. The symbols are the same used for Fig. 4. An isoline corresponding to is plotted on all maps between January and May and depicts the 4–4.5 deep high-attenuation anomaly. Panel (a) shows how the microseismicity progressively crosses the location of the last eruption, mainly following La Starza marine terrace. Panel b depicts the microearthquakes recorded on April 1: in this case, black (orange) circles are earthquakes recorded above (below) the maximum depth of the caprock14. The white ellipsoidal contour on the map and BB’ vertical section shows the area of densest microseismicity. In panel c, this same area becomes aseismic for 2 months. Almost no maximum likelihood hypocentres is located in the ellipsoid (left and right plots) while the PDF show a clear gap under Pozzuoli (central plot). Panel d depicts the end of the seismic unrest, with earthquakes repeatedly crossing the are of Mount Nuovo below the caprock (orange dots, see also the PDF) and following a NNW-SSE striking fault offshore21, 31. The figure wa created using the same softwares and data described in Fig. 4 (ESRI ArcGIS 10.0©, https://www.esri.com/training/catalog/5763042b851d31e02a43ed4d/using-arcmap-in-arcgis-desktop-10/; Voxler 3.0©, http://www.goldensoftware.com/products/voxler; Photoshop CS©, https://helpx.adobe.com/uk/x-productkb/policy-pricing/cs6-product-downloads.html; SeismicityViewer, http://alomax.free.fr/nlloc/.
