
Figure 2.
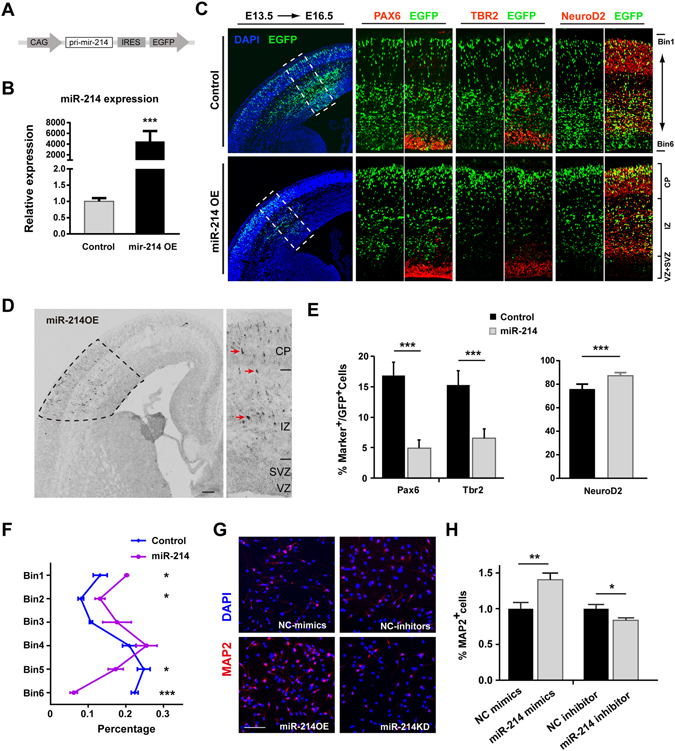
miR-214 promotes the differentiation of neural progenitor cells and NSCs. (A) The miR-214 overexpression construct. The miR-214 precursor hairpin sequences and both side flanking sequences were cloned and inserted into the pCIG vector. (B) Quantitative real-time PCR analysis of the overexpression of miR-214 in HEK-293ET cells 48 hours post-transfection. The expression of miR-214 was normalized to that of the U6 snRNA (n = 4 independent biological repeats). Error bars show the standard error of mean, and the comparisons were performed by Student’s t-test; the statistically significant P values are shown as ***(<0.001). (C–F) Sections of the E16.5 forebrains electroporated at E13.5 with plasmids expressing GFP alone (top panel) and those co-expressing miR-214 (bottom panel), and double-labelling was used to detect the expression of Pax6 (C, left panel), Tbr2 (C, middle panel) or NeuroD2 (C, right panel) in GFP+ cells. In situ hybridization was used to examine the expression of the exogenous miR-214 in D. The dashed line in the left panel indicates the region where the transfected cells are distributed, and the arrows in the right panel showed the overexpression signal in a detailed view. CP, cortical plate; IZ, intermediate zone; SVZ, subventricular zone; VZ, ventricular zone. (E,F) Quantitative analysis of the E16.5 dorsal forebrains for the fraction of GFP+ cells co-expressing the markers (E) and for the distribution of those by dividing the neocortex into 6 equal bins (F) within the transfected neocortex (n = 5 brains from 3 surgeries for the control and 4 brains from 3 surgeries for miR-214 OE). Error bars show the standard deviation, and the comparisons were performed by Student’s t-test. (G,H) miR-214 stimulates the neuronal differentiation of cultured NPCs. Cells were transfected with miR-124 mimics, the miR-124 inhibitor or the related control and induced with RA. Two days after treatment, the cells were fixed and stained with neuron marker MAP2. Scale bar: 100 μm. (H) The ratio of the MAP2 positive cells in the miR-214 mimics, miR-214 inhibitor and control groups (n = 10, **p = 0.005). Error bars show the standard error of mean, and the comparisons were performed by Student’s t-test, the statistically significant P values are shown as *(<0.05), **(<0.01) or ***(<0.001).