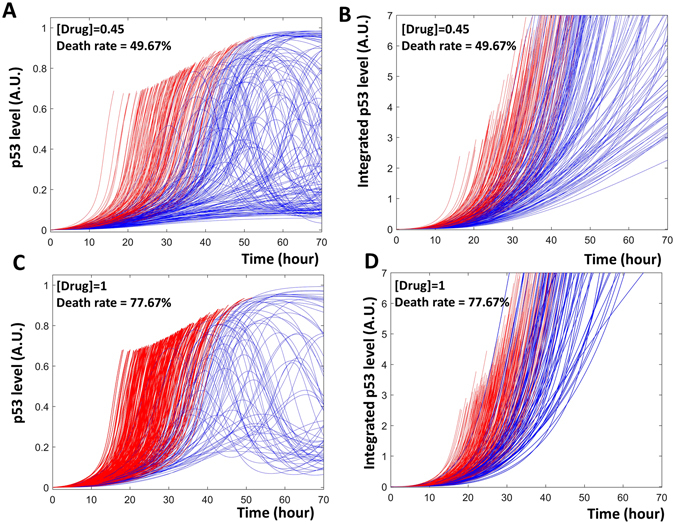
Figure 2.

Time series simulation of fractional killing. Panels A and C show the absolute levels of p53, while panels B and D show the time integrated levels. (A and B) A total of 300 cells are subjected to a low level of drug (drug = 0.45), about half of the cells in the population quickly activate p53 and undergo apoptosis (red curves in A and B). In the remaining cells, p53 is slowly activated and these cells survive (blue curves in A and B). (C and D) When a population of 300 cells are treated with a high level of drug (drug = 1), a higher percentage of cells activate their p53 fast and undergo apoptosis (red curves in C and D).
