Figure 5.

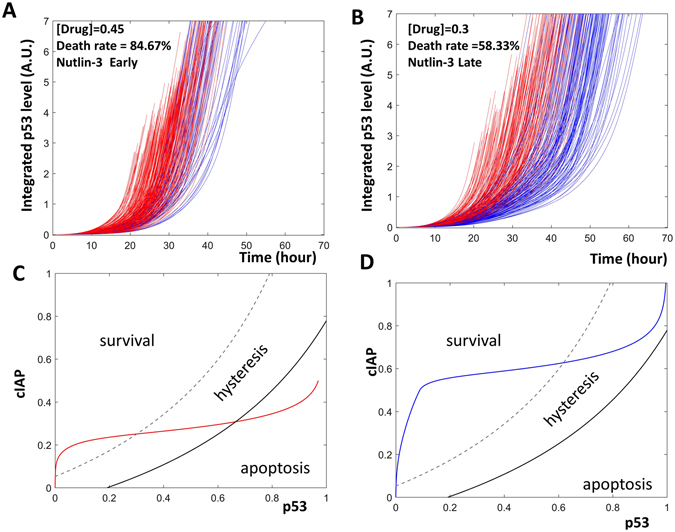
The timing of Nutlin addition controls cellular fates. (A and B) The time series simulations. The green, black, blue, and red curves indicate Nutlin, p53, CIAP and BAXm, respectively. Early Nutlin addition triggers BAXm activation (A). A late addition of Nutlin does not trigger the activation of BAXm (B). (C and D) Two parameter bifurcation diagrams together with the temporal trajectories of the apoptotic or surviving cells. Nutlin addition does not change the bifurcation geometry of the cells. Rather, an early addition of Nutlin pushes the cell trajectory into the apoptosis area (red curve, C), while a late Nutlin addition does not (blue curve, D).
