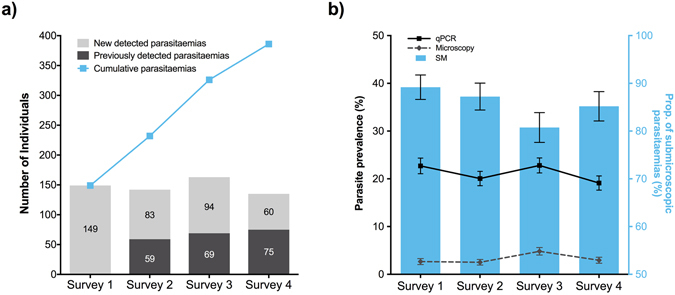
Figure 2.

Distribution of P. vivax parasitaemia and parasite prevalence over time (4 ACD surveys): (a) Number individuals with new detected (light grey bars), previously detected (dark grey bars) and cumulative (light blue squares) P. vivax parasitaemia, and (b) P. vivax parasite prevalence by microscopy (grey dashed line), and qPCR (black solid line), and the proportion of submicroscopic parasitaemia (SM, light blue bars) in each survey round. Error bars represent the standard error of the proportion (SEP) in each survey round. Surveys were conducted from May to July 2015, with 10 days between surveys.
