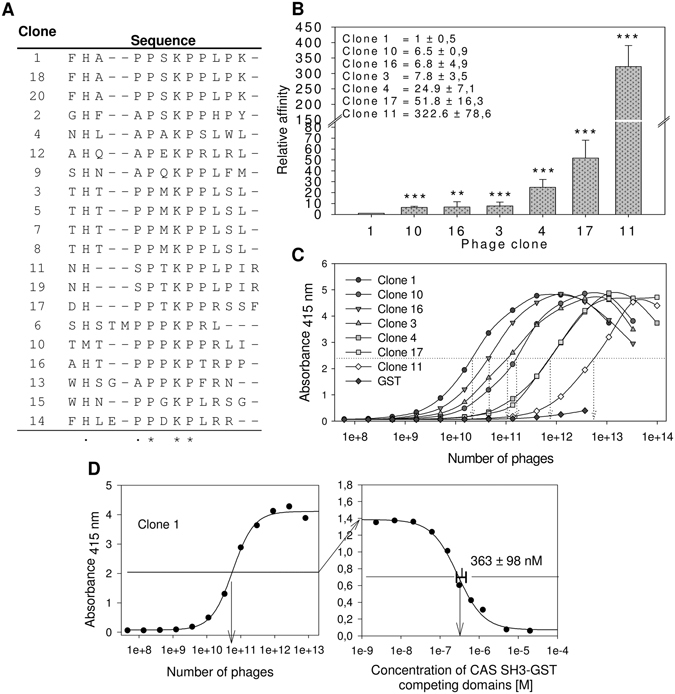
Figure 2.

Screening of the CAS SH3 domain binding motif using phage display. (A) Sequences of 20 aligned clones. (B) ELISA quantification of the relative affinities of seven phage-displayed peptides towards the GST-fused CAS SH3 domain. Relative affinities were calculated based on the binding affinity of clone 1 (the tightest binder). The data are expressed as average ± standard deviation from five independent experiments. Statistical significance (**p < 0.01, ***p < 0.001) was determined on log-transformed data by one-way repeated-measures ANOVA followed by Tukey’s post-hoc test. (C) Representative curves of relative affinities of seven phage-displayed peptides towards the GST-fused CAS SH3 domain. GST alone with clone 1 was used as a negative control. D Representative graph for the EC50 value (363 +/− 98 nM) for clone 1 binding obtained from seven independent experiments.
