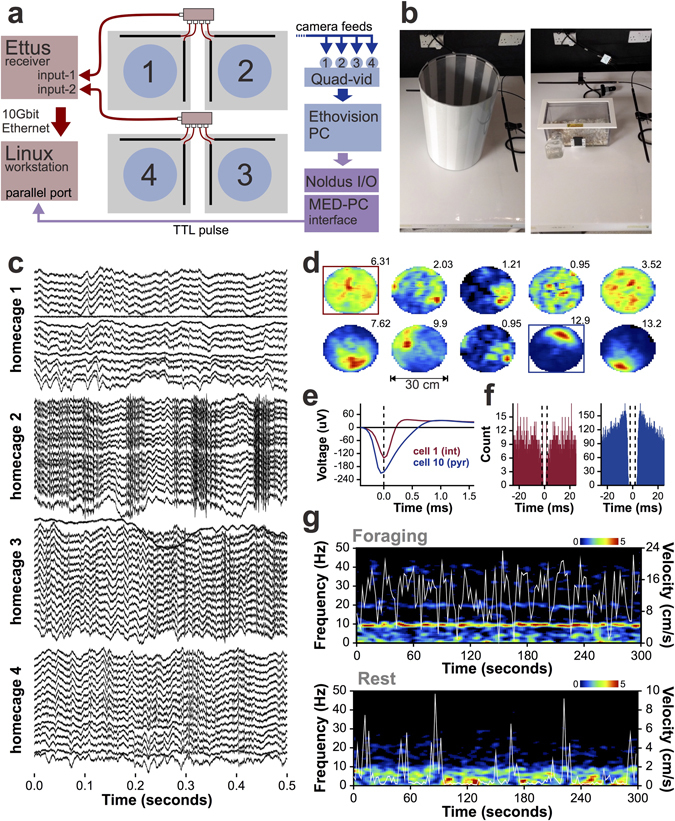
Figure 4.

In vivo recordings with TaiNi. (a) Recording configuration diagram, illustrating integration of electrophysiological (pink/red) and behavioural (blue) data streams. Boxes in purple represent the sync-pulse pathway connecting the two systems. A separate Linux workstation and Windows PC run the TaiNi and EthoVision acquisition software, respectively. Boxes in purple represent the sync-pulse pathway connecting the two systems. Blue circles represent the pellet foraging arenas, Grey squares are the infrared tables. Black rods represent the antennas on each table, which feed to a 4-way signal-joiner. (b) The pellet-foraging arena (left) and the home-cage used for sleep/rest recordings (right). (c) Simultaneous recordings from 4 mice in the home-cages. Each mouse contributes 16 traces - one from each channel on the electrode. Local field potentials are evident in all animals. The mouse in home-cage 2 shows recordings indicative of muscular artefacts typical of chewing or scratching. Action potentials can be seen in the recordings from home-cage 4. (d) Spatial firing fields of 10 neurons recorded from the CA1 field of the dorsal hippocampus of one of the mice, during the pellet foraging task. Mean firing rates are indicated above each heat-map. Warm colours represent higher firing rates. The blue box highlights a putative pyramidal cell (place-cell) with a characteristic well defined firing field on the north side of the arena. The red box highlights a putative interneuron with a more diffuse firing pattern. (e) Mean action-potential waveforms of the interneuron (int) and pyramidal cell (pyr). (f) For the same two cells, the action-potential autocorrelogram, highlighting the wider refractory-period and burst-firing tendency (pronounced peaks at ±5 ms) for the pyramidal cell (blue). (g) Five minutes of the hippocampal power spectrum from a mouse chasing pellets in the arena (top) or resting in the home-cage (bottom). Running speed (cm/s) is overlaid in white. Note the frequent pauses during foraging which accompany momentary reductions in the 4–12 Hz theta band. During rest, brief bursts of movement interrupt the 0.5–4 Hz delta power.
