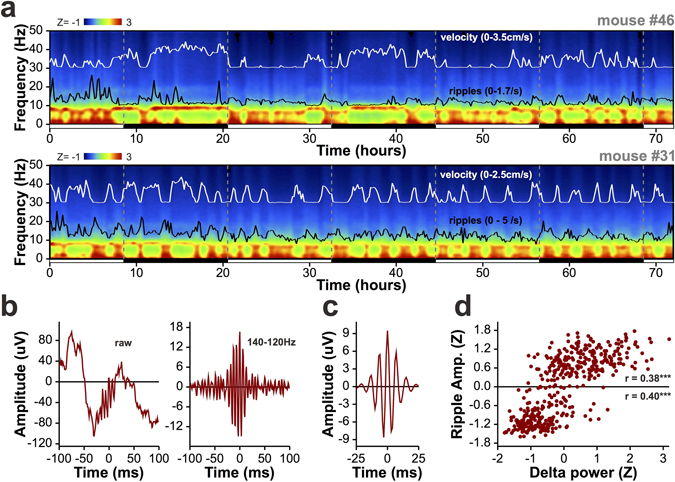
Figure 5.

72-hour recordings from two mice in the home-cage. (a) The time-course of spectral power in the hippocampus across the 0–50 Hz frequency range for two mice. White lines show running speed, and black lines represent the density of 140–220 Hz ripple-oscillations, integrated in 10-minute bins. Black and white bars below each graph indicate whether the lights were on (white) or off (black) during the recording, and vertical dashed grey lines mark the transitions between light-cycles. The top panel represents a mouse with a clear diurnal pattern of activity, while the mouse in the lower panel has a much more erratic pattern of activity. For both animals, ripple density tracks power in the delta band, while theta dominates during periods of high mobility. (b) A representative ripple from mouse #31, before (left) and after(right) filtering in the ripple band. (c) The peak-aligned average ripple during periods of immobility from the 72-hour recording. This represents 16315 ripples collected during 1014 minutes. (d) For 10-minute non-overlapping bins spanning the entire 72-hours, mean ripple amplitude as a function of mean 0.5–4 Hz delta power in each bin. Both measures are normalized to the mean and standard deviation of the values across bins. The individual ripple-amplitude distributions above and below the mean are significantly, positively correlated with delta power. ***p < 0.001.
