Figure 6.

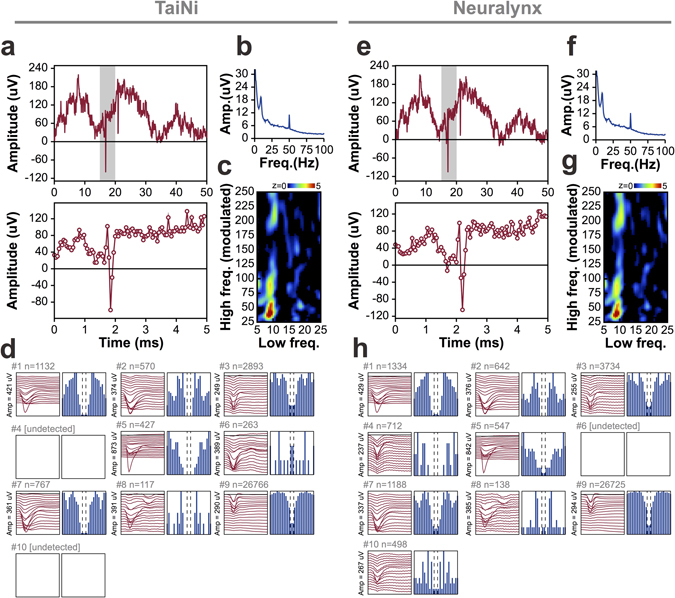
Comparison between the wireless TaiNi system (left) and a Digital Neuralynx tethered system (right). Data was split at the connector on the mouse’s head and fed to both systems simultaneously for comparison. (a,e) Matching raw traces as processed by the two systems, highlighting action potentials and theta oscillations. Bottom panels are enlarged views of the grey zone in the top panel. (b,f) Power spectra for the entire 10-minute recording. (c,g) Phae-amplitude coupling analysis, showing clear modulation of the amplitude of gamma (centred at ~37 Hz) by the phase of theta (centred at ~8 Hz) oscillations. (d,h) Comparison of spike-sorting results from the two systems, with identified cells (clusters) represented by their mean action-potential depth-profile (red traces) and their autocorrelograms (in blue). The display topographical with the same putative cell occupying the same position in (d) and (h). TaiNi tends to detect somewhat fewer spikes overall, and both systems sometimes identify clusters not found by the other. Overall however, the results are quite similar.
