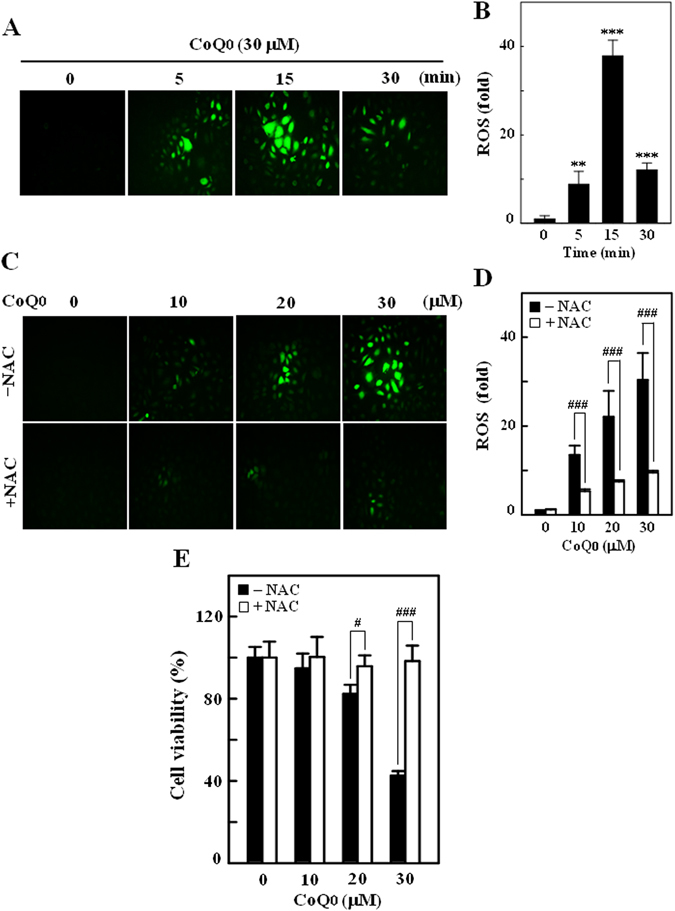
Figure 2.

CoQ0 induces intracellular ROS generation in SKOV-3 cells. (A) Cells were treated with CoQ0 (30 µM) for 0–30 min and generation of intracellular ROS were measured using fluorescent microscopy (200 × magnification). The non fluorescent probe DCFH2-DA reacts with cellular ROS and metabolized into fluorescent DCF. (B) The fluorescence intensity of DCF-stained cells, represent the levels of ROS was quantified by Olympus Soft Imaging Solution, and presented as histogram. Results are significant at **p < 0.01; ***p < 0.001 compared to time 0 min. (C) Cells were treated with CoQ0 (10–30 µM) for 15 min, and ROS generation was measured in the presence or absence of ROS inhibitor (2 mM NAC, 1 h prior to CoQ0). The levels of intracellular ROS were indicated by strong or weak fluorescence intensity. (D) ROS levels were quantified and expressed in bar diagram as percentage of control. (E) Cells were treated with ROS inhibitor (NAC, 2 mM) 1 h prior to CoQ0 treatment (0–30 µM, 24 h), and cell viability of was determined by MTT assay. Results expressed as mean ± SD of three independent assays (n = 3), and significant at # p < 0.1; ### p < 0.001 compared with CoQ0 alone treated cells.
