Figure 7.

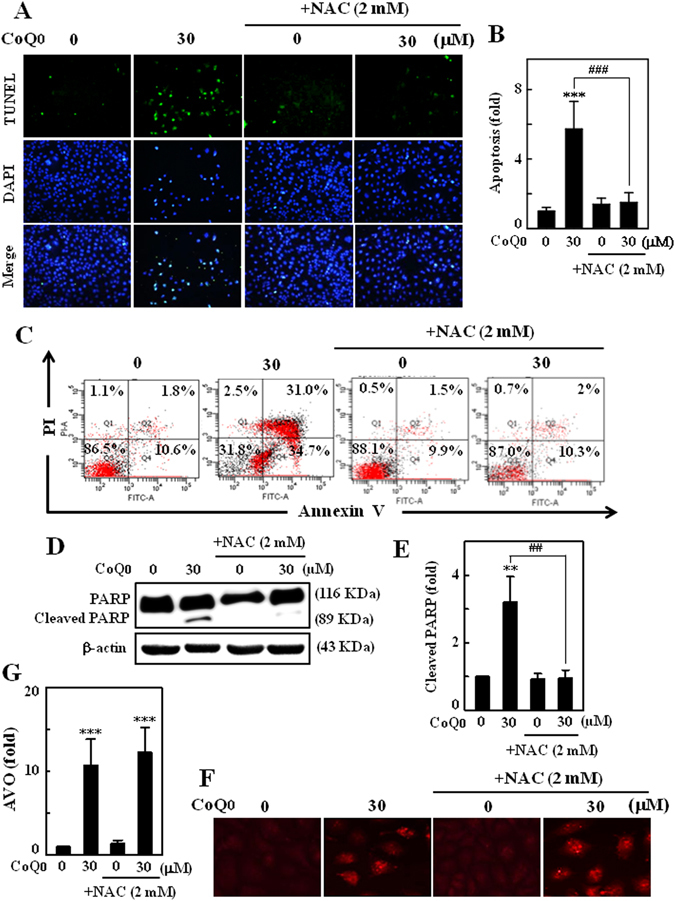
CoQ0-induced ROS involved in induction of SKOV-3 apoptosis, but not autophagy. (A–G) Cells were pretreated with NAC (2 mM) for 1 h, and then incubated with CoQ0 (30 µM) for 24 h. (A) Induction of apoptosis (DNA fragmentation) was determined by TUNEL assay in the presence or absence of NAC. The green florescence indicates TUNEL-positive cells in microscopic fields (200 × magnification). (B) The fold of apoptotic cells was calculated by measuring the florescence intensity using commercially available software. (C) Annexin-V-FITC and PI staining was used to identify the early/late apoptosis or necrosis of SKOV-3 cells. (D) Cleavage of PARP was monitored by Western blot. (E) Changes in protein intensities were quantified using commercially available software. (F) Formation of AVOs was visualized under a red filter fluorescence microscope (100 × magnification) using AO stain. (G) Number of AO stained cells with CoQ0 or NAC was presented as histogram, control being as 1.0 fold. Results expressed as mean ± SD of three independent assays (n = 3). Significant at **p < 0.01; ***p < 0.001 compared with untreated control, and significant at ## p < 0.01; ### p < 0.001 compared with CoQ0 alone treated cells.
