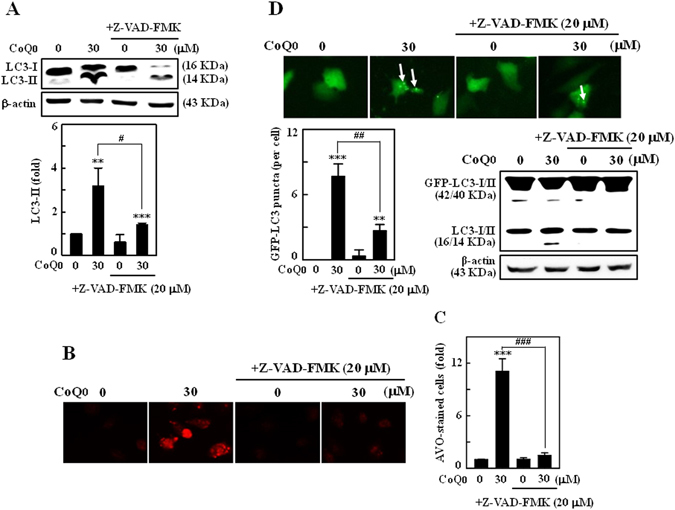
Figure 8.

Inhibition of apoptosis suppressed CoQ0-induced autophagy in SKOV-3 cells. (A–C) Cells were pretreated with caspase inhibitor (Z-VAD-FMK, 20 μM) for 1 h, and then incubated with CoQ0 (30 µM) for 24 h. (A) LC3-I/II was determined using Western blot, and relative changes in protein intensities were quantified using commercially available software. (B) Formation of AVOs was visualized under a red filter fluorescence microscope (100 × magnification) using AO stain. (C) Number of AO stained cells with CoQ0 or Z-VAD-FMK treatment was presented as histogram, control being as 1.0 fold. (D) Cells were transfected with GFP-LC3 expression vector for 24 h before Z-VAD-FMK and CoQ0 treatment. GFP-LC3 dots in cells were observed under a confocal microscope (200 × magnification). Conversions of GFP-LC3 and endogenous LC3 were determined by Western blot. Results expressed as mean ± SD of three independent assays (n = 3). Significant at **p < 0.01; ***p < 0.001 compared with untreated control, and significant at # p < 0.05; ## p < 0.01; ### p < 0.001 compared with CoQ0 alone treated cells.
