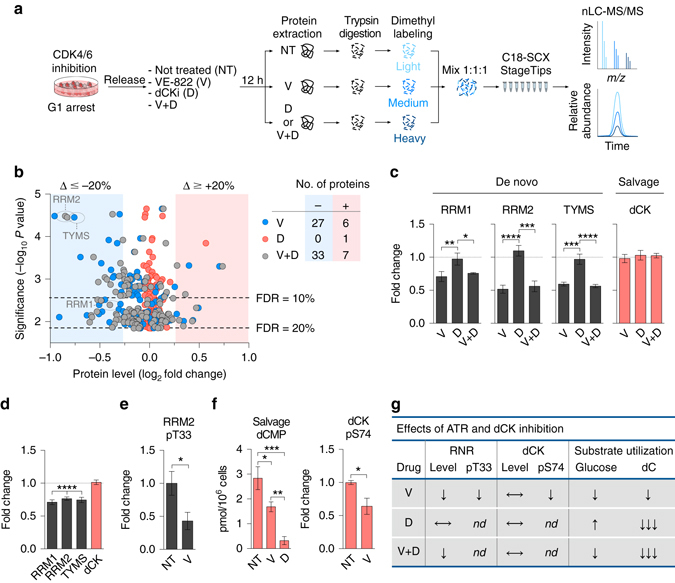
Fig. 2.

Alterations in total protein and phosphoprotein levels following ATR and dCK inhibition. a Workflow for quantitative global proteomics using nLC-MS/MS. See text for details. b Comparison of protein levels in CEM cells treated with VE-822 and/or dCKi for 12 h following release from G1 arrest. Number of proteins exhibiting fold changes greater than 15% changes with significance at a false discovery rate ≤ 20% are indicated. c Protein levels of nucleotide biosynthetic enzymes (mean ± s.d., n = 3, one-way analysis of variance (ANOVA, Bonferroni corrected). d Protein levels in asynchronous CEM cells treated with VE-822 (1 µM) for 12 h (mean ± s.d., n = 3, one sample t-test to assess if the mean of the protein level normalized to untreated control is equal to one). e Relative level of RRM2 pT33 normalized to RRM2 protein level from d, in asynchronous CEM cells treated with VE-822 (1 µM) for 12 h (mean ± s.d., n = 3, unpaired two-tailed Student’s t-test). (f, left panel) Salvage produced [13C9,15N3]dCMP in asynchronous CEM cells treated with VE-822 or dCKi for 12 h (mean ± s.d., n = 3, one-way ANOVA, Bonferroni corrected). (f, right panel) Relative levels of dCK pS74, after normalized to dCK protein level from d, in asynchronous CEM cells treated with VE-822 (1 µM) for 12 h (mean ± s.d., n = 3, unpaired two-tailed Student’s t-test). g Summary of the observed effects of ATR and dCK inhibition in CEM cells. ↓ partial decrease/inhibition, ↓↓↓ nearly complete inhibition, ↑ increase, ⟷ no change, nd not determined. NT = Not treated, V = VE-822, D = dCKi, V + D = VE-822 + dCKi. *P < 0.05; **P < 0.01; ***P < 0.001; ****P < 0.0001. nLC-MS/MS nano liquid chromatography tandem mass spectrometry, RRM1 ribonucleotide reductase subunit 1, RRM2 ribonucleotide reductase subunit 2, TYMS thymidylate synthase, dCK deoxycytidine kinase, dCMP deoxycytidine monophosphate
