Figure 3.

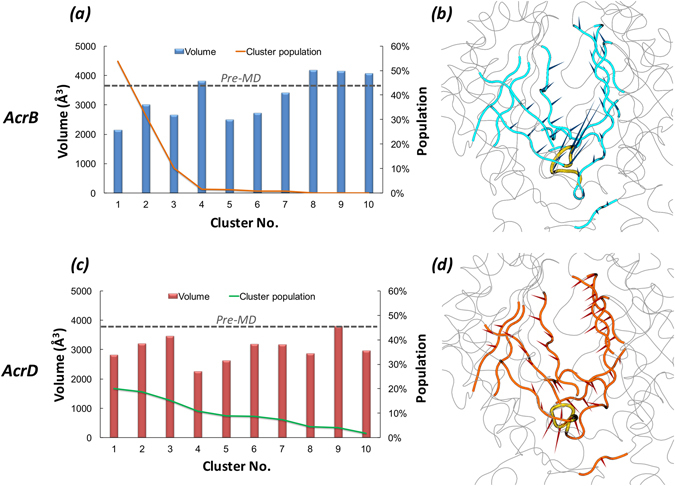
Volume dynamics of AP in the Loose protomer of AcrB and AcrD. (Left Panels) Distribution of the volume of AP within the Loose protomer of AcrB (a) and AcrD (c), calculated for the 10 top cluster representatives extracted from equilibrium MD trajectories. Histograms refer to the values of the volume, lines to the relative population of the corresponding clusters. The volumes calculated for the pre-MD structures of AcrB and AcrD are shown as dashed line. (Right Panels) Porcupine plots representing collective motions along the first principal-component eigenvector for AP in AcrB (b) and AcrD (d) simulations shown as arrows (>2 Å) attached to Cα atoms indicating the magnitude of the corresponding eigenvalues. The loop lining the base of AP (‘bottom-loop’) showing large rearrangement in AcrB but not in AcrD are coloured yellow in both.
