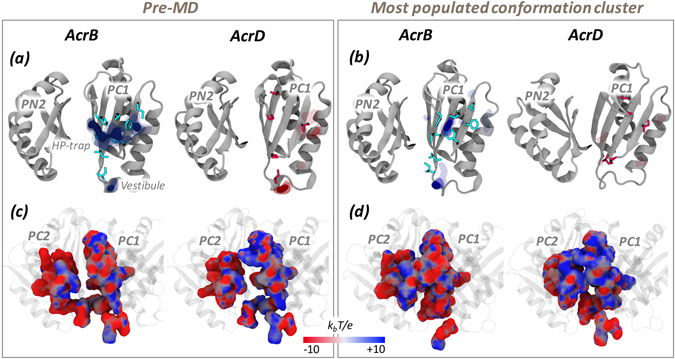
Figure 4.

MLP and electrostatic potential of AP in the Loose protomer of AcrB and AcrD. MLP isosurfaces observed within 4 Å of AP in the Loose protomer of AcrB (blue) and AcrD (red) in pre-MD (a) and the representatives of the most populated cluster (b) as seen from the centre of the protomer. The hydrophobic/aromatic residues in the AP are shown as sticks in the structures. Isosurfaces at 0.75 (solid), 0.5 (dark transparent) and 0.25 (light transparent) are shown in blue (AcrB) or red (AcrD). The HP-trap and Vestibule sites are also labeled in the pre-MD structure of AcrB. The electrostatic potential plotted on the molecular surface representation of AP in the Acr proteins in the pre-MD (c) and the most populated cluster representative (d) as seen from the periplasmic front of the protomer. The colour code is red to blue from negative (−10 kbT/e) to positive (+10 kbT/e) potential, where kb is the Boltzmann constant, T is the absolute temperature and e is the electron charge.
