
Figure 9.
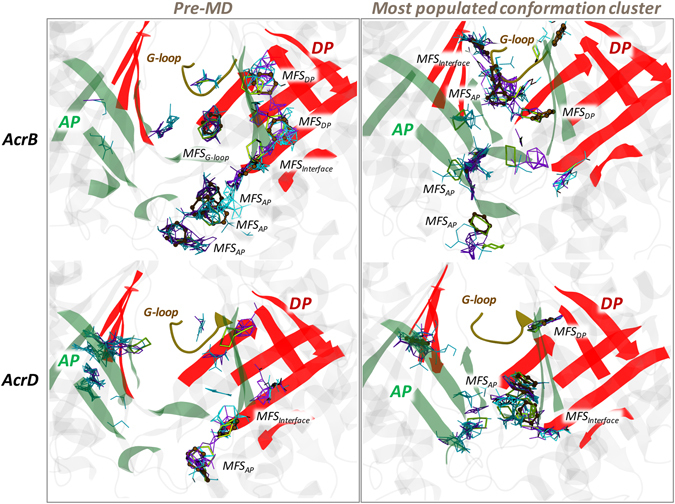
MFSs identified in the AP and DP of AcrB and AcrD. MFSs in the AP and DP of pre-MD (left panels) and the most populated cluster representative (right panel) structures of AcrB and AcrD. The binding modes of the different probes are shown as lines for hydrogen-bond donor (cyan), hydrogen-bond acceptor (violet) and aliphatic (yellow), and as CPK for aromatic (ochre) ligands. The AP and DP are marked in green and red, respectively, while the G-loop in yellow cartoon representations. (Note: The categorizing of MFSs here is arbitrary due to indistinct boundaries between the pockets. The sites not labelled as MFS here are all CSs).