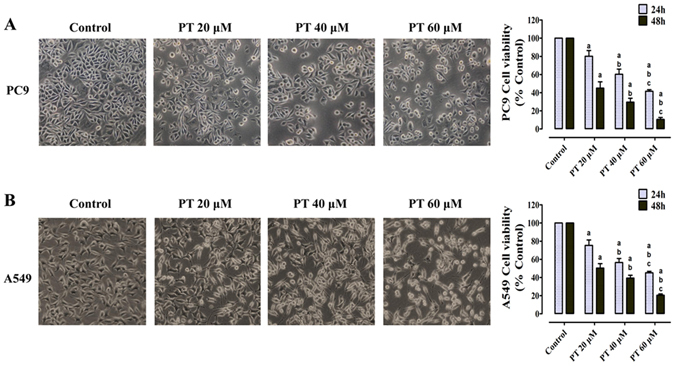
Figure 1.

Effect of PT treatment on the viability and morphology of PC9 and A549 cells. Both cell lines were treated with increasing concentrations of PT (20, 40, and 60 μM) and assessed at time points of 24 and 48 h. The cell viability was analyzed by CCK-8 and expressed as OD values (% Control). The morphology of both cells were observed under an inverted phase-contrast microscope after the cells were treated for 24 h, and images were obtained. Significant cell shrinkage and a decreased cellular attachment rate were observed in the PT treatment groups with a dose dependent manner. All of the results were expressed as the mean ± SD; n = 6. aP < 0.05 vs. the control group, bP < 0.05 vs. the 20 μM PT-treated group, cP < 0.05 vs. the 40 μM PT-treated group.
