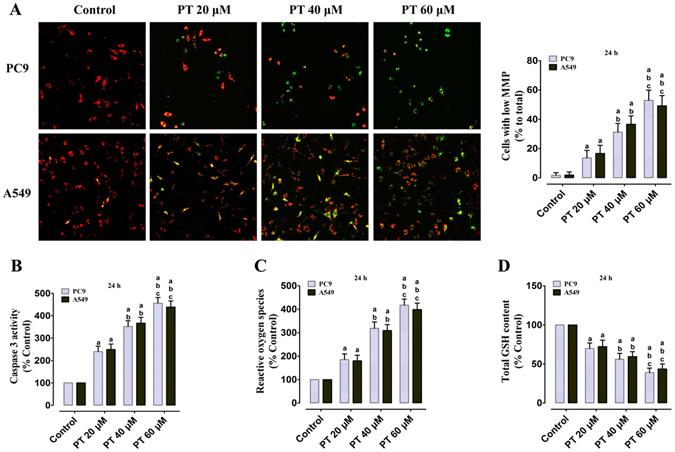
Figure 3.

Effect of PT treatment on the depolarization of mitochondrial membrane, Caspase 3 activity, ROS generation, and GSH level in PC9 and A549 cells (24 h). (A) Representative merged images of JC-1 red (normal MMP)/green (low MMP) cells, and the MMP levels were expressed as the proportion of cells with a low MMP. (B) Intracellular Caspase 3 activity; (C) ROS concentration; (D) Intracellular GSH level; and those three indexes in the control group were defined as 100%. All of the results were expressed as the mean ± SD; n = 6. aP < 0.05 vs. the control group, bP < 0.05 vs. the 20 μM PT-treated group, cP < 0.05 vs. the 40 μM PT-treated group.
