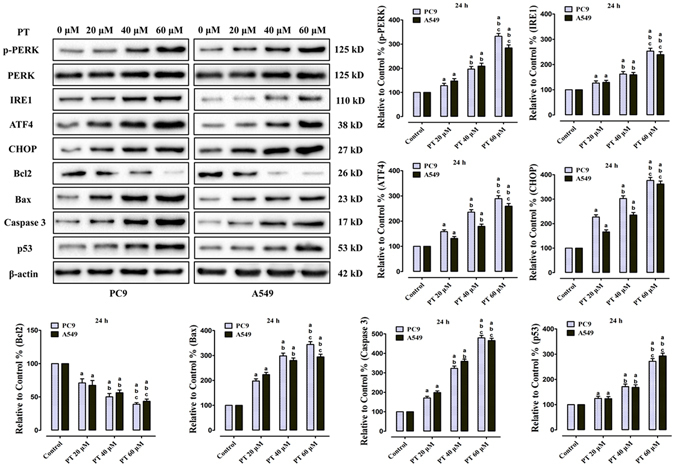
Figure 5.

Effect of PT treatment on the ERS signaling and apoptosis-related proteins in PC9 and A549 cells (24 h). Representative western blot results of p-PERK, PERK, IRE1, ATF4, CHOP, Bcl2, Bax, Caspase 3, p53 were shown. Membranes were re-probed for β-actin expression to show that similar amounts of protein were loaded in each lane. All of the results were expressed as the mean ± SD; n = 6. aP < 0.05 vs. the control group, bP < 0.05 vs. the 20 μM PT-treated group, cP < 0.05 vs. the 40 μM PT-treated group.
