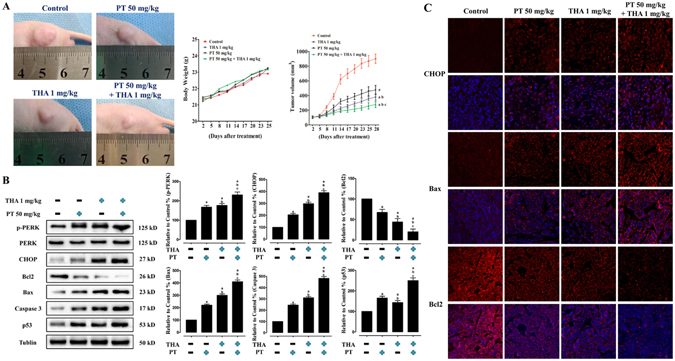
Figure 8.

Effect of PT treatment combined with THA on tumor volume, body weight of nude mice, ERS pathways and apoptosis-associated proteins on PC9 tumor xenografts in vivo. (A) Photographs showing tumor xenograft morphologies in each group, changes in body weight of nude mice, and tumor growth curve drawn from the tumor volumes and treatment duration were provided. (B) Representative western blot results of the key proteins, including p-PERK, CHOP, Bcl2, Bax, Caspase 3, and p53 were shown. Membranes were re-probed for Tublin expression to show that similar amounts of protein were loaded in each lane. (C) Representative immunohistofluorescence staining images showed CHOP (red fluorescence) in the cell nucleus, Bax and Bcl2 (red fluorescence) in the cytoplasm, and DAPI (dark blue fluorescence) in the cell nucleus. The results were expressed as the mean ± SD; n = 6. aP < 0.05 vs. the control group, bP < 0.05 vs. the 50 mg/kg PT-treated group, cP < 0.05 vs. the 1 mg/kg THA-treated group.
