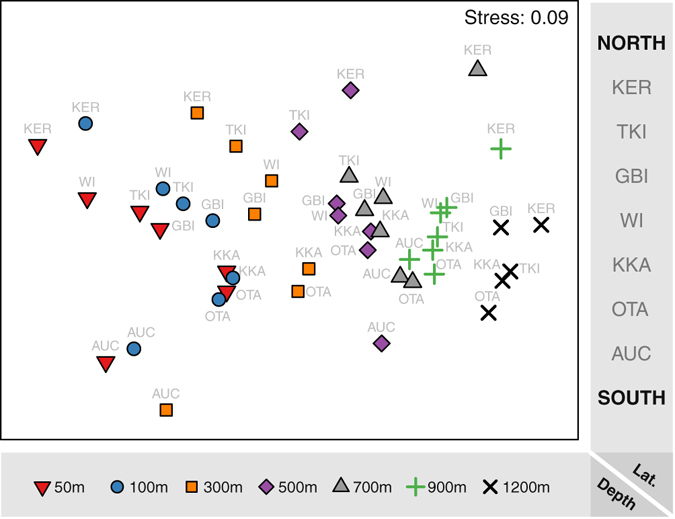
Figure 2.

Ordination analysis of fish communities by depth and latitude. Non-metric multi-dimensional scaling (nMDS) ordination plot of Jaccard dissimilarities among fish assemblages consisting of depth-by-location averages (centroids) from a minimum of n = 6 video deployments (except for the Auckland Islands and White Island where no deployments were made at 1200 m). Each centroid is identified by a symbol to indicate the depth (50, 100, 300, 500, 700, 900 or 1200 m) and a label to indicate the location (from north to south: Kermadec Islands (KER), Three Kings Islands (TKI), Great Barrier Island (GBI), White Island (WI), Kaikoura (KKA), Otago (OTA) and the Auckland Islands (AUC)).
