
Figure 3.
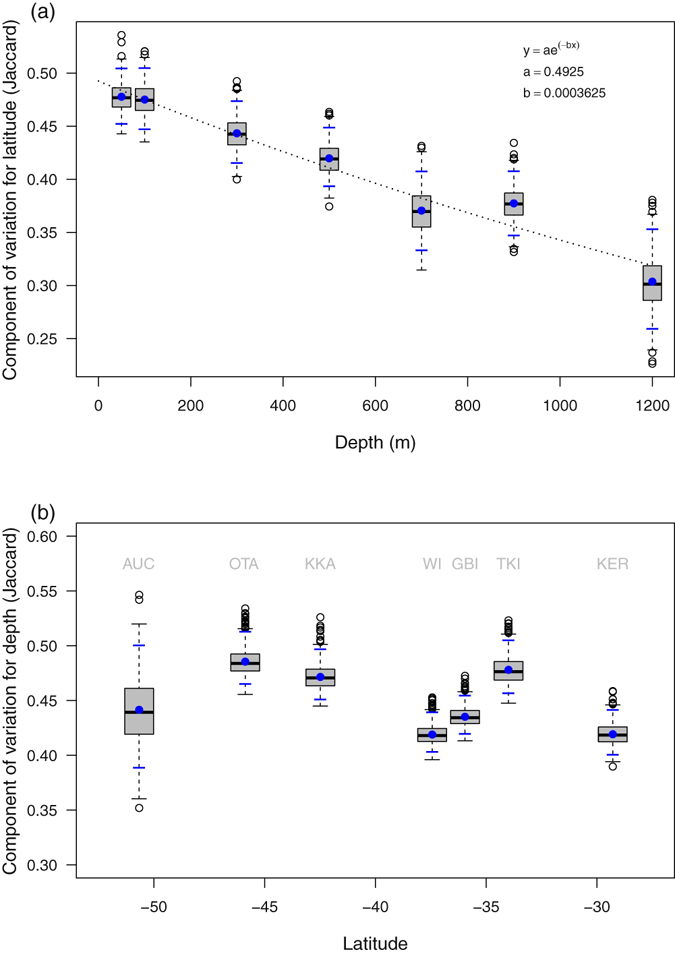
Large-scale beta diversity of fishes versus depth and latitude. Relationship between (a) component of variation within each depth stratum (a surrogate for latitudinal beta diversity) vs depth; and (b) component of variation within each location (vertical beta diversity) vs latitude, based on square-root-transformed pseudo multivariate components of variation calculated from a PERMANOVA partitioning of Jaccard dissimilarities (blue dots). Box plots in grey show distributions of values from 1000 bias-corrected separate-sample bootstraps of residuals. Blue dashes show 95% confidence intervals based on the 0.025 and 0.975 quantiles of the bias-corrected bootstrap distributions. The dotted line in (a) shows the exponential model of the decay in latitudinal beta diversity vs depth.