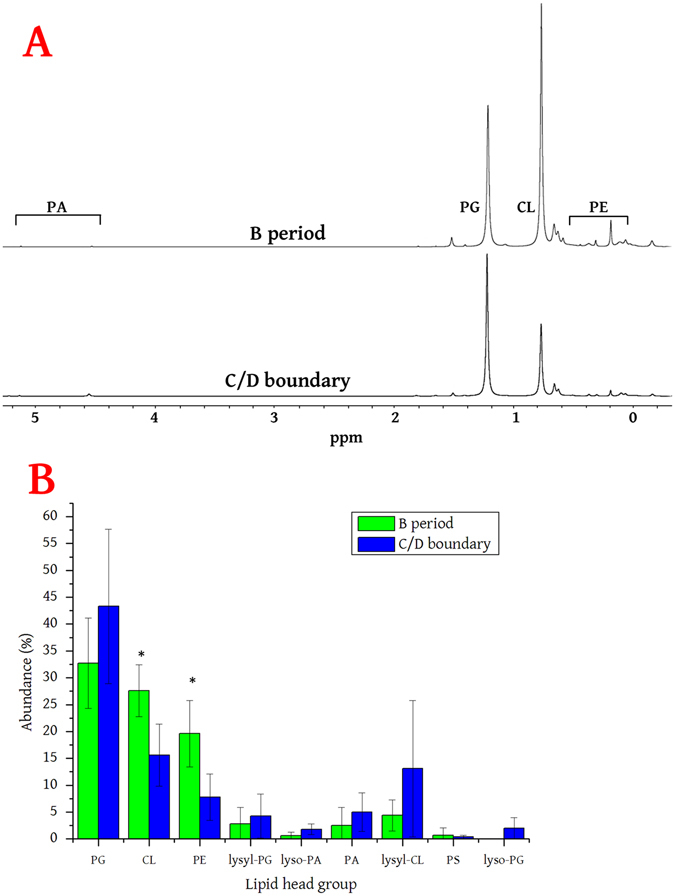
Figure 2.

Profiling of the phospholipids in L. innocua NCTC 11288 at different stages of the cell cycle. Panel A shows representative 31P NMR spectra of the lipid fraction collected from B period cultures and cultures at the boundary of the C and D periods. The relative area of the integrations of the appropriate resonance(s) were taken as a fraction of the total integrations for each spectrum and used to generate the fraction size given for each sample. The shift of phosphate mono-ester-containing lipids such as PA, is pH dependent. PE exhibits several resonances due to concentration and pH-dependent solvent interactions15, 78. Panel B shows the abundance of lipids in the B period and at the C/D period boundary from cells collected in the exponential phase. Asterisks mark the head groups (CL, PE) for which the difference in abundance is considerable (when comparing standard deviations, n = 5 independent samples profiled using quantitative 31P NMR). CL, cardiolipin; lyso-PA, lyso-phosphatidic acid; lyso-PG, lyso-phosphatidylglycerol; lysyl-CL, lysyl-cardiolipin; lysyl-PG, lysyl-phosphatidylglycerol; PA, phosphatidic acid, PE, phosphatidylethanolamine; PG, phosphatidylglycerol; PS, phosphatidylserine.
