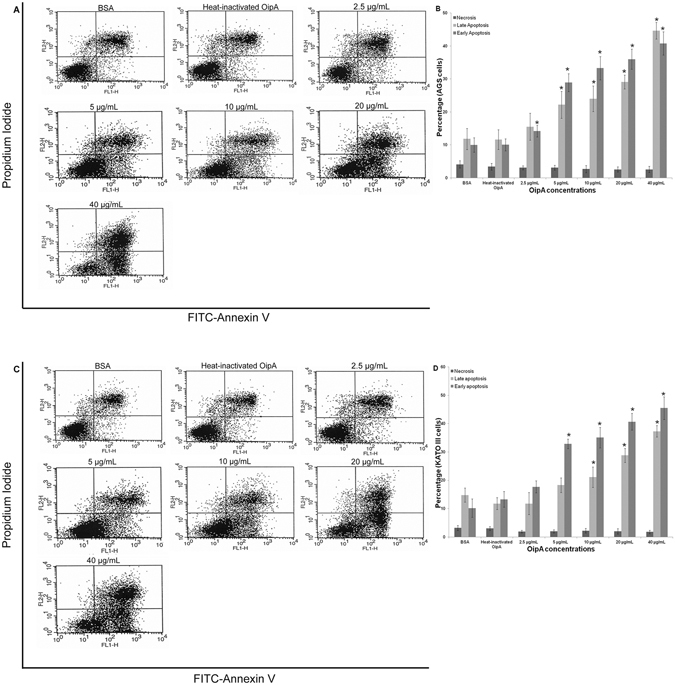
Figure 3.

Apoptotic effects (%) of various concentrations of OipA on AGS and KATO III. AGS and KATO III were treated with different concentrations of OipA or heat-inactivated OipA or BSA as negative controls for 24 h and apoptosis was detected by FITC-Annexin V/Propidium Iodide staining. Representative flow-cytometrydot-plots showing the level of apoptosis in AGS (A) and KATO III (C). Bottom left: live cells, top left: necrosis, bottom right: early apoptosis, top right: late apoptosis. The results are expressed as the mean ± SD, (n = 3, three independent experiments) (B and D). Statistically significant differences with the control group are indicated with * (p < 0.05).
