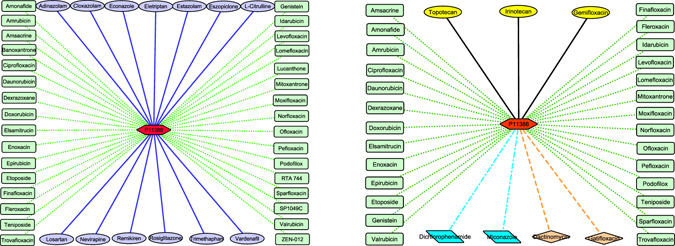
Figure 9.

New drug repositioning candidates of P11388. Figure (a) describes the known DTIs and extracted NDTISs of P11388. Red hexagon denotes P11388, the green dotted lines denote known DTIs, the blue solid lines denote extracted NDTISs in (a). Figure (b) describes predicted DTIs of P11388. The green dotted lines denote successfully predicted DTIs, the orange dash lines denote predicted DTIs that can be validated by the related databases, the azure dash dotted lines denote predicted DTIs which have been reported by ref. 26, the black solid lines denote the other predicted results in (b).
