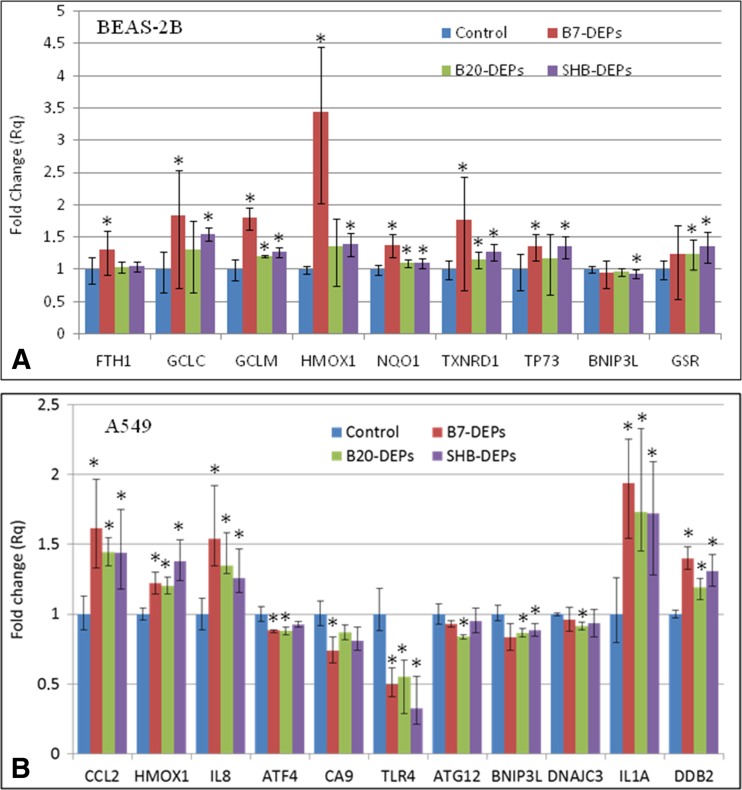
Fig. 9.
Changes in gene expression in BEAS-2B cells (a) and A549 cells (b) after treatment with 50 μg/mL of three types of DEPs for 6 h. Mean fold-change values from three independent experiments are presented. Error bars represent minimum and maximum values in a sample. Fold changes statistically significant in Student’s t test are highlighted (asterisk)

