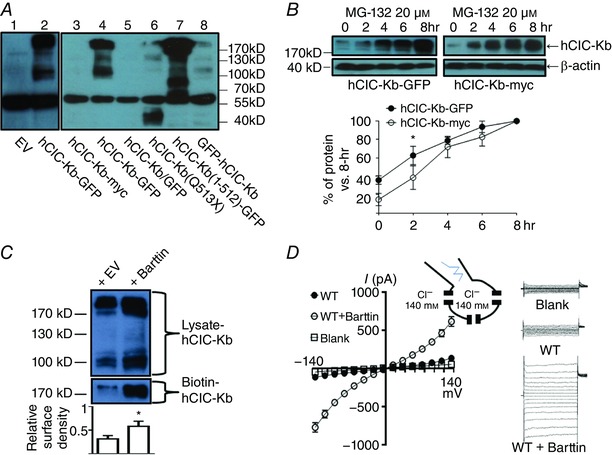
Figure 1. Functional studies of human ClC‐Kb (hClC‐Kb) in a mammalian expression system.

A, protein expressions of human ClC‐Kb (hClC‐Kb) in HEK‐293 cells transfected with different CLCNKB constructs were detected by Western blot using anti‐CLCNKB antibody. EV: empty vector, hClC‐Kb‐GFP: wild‐type CLCNKB in pCMV6‐AC‐GFP, hClC‐Kb‐myc: wild‐type CLCNKB in pCMV6‐AC‐entry, hClC‐Kb/GFP: wild‐type CLCNKB in pIRES‐hrGFP, hClC‐Kb(Q513X): Q513X mutant CLCNKB in pCMV6‐AC‐GFP, hClC‐Kb(1–512)‐GFP: the truncated amino acid 1–512 of CLCNKB in pCMV6‐AC‐GFP, GFP‐hClC‐Kb: wild‐type CLCNKB in pEGFP‐C2. The estimated molecular weights of hClC‐Kb‐myc and hClC‐Kb/GFP were ∼75 kDa, hClC‐Kb‐GFP and GFP‐hClC‐Kb were ∼102 kDa, hClC‐Kb (Q513X) was ∼56 kDa and hClC‐Kb (1–512)‐GFP was ∼83 kDa. B, protein levels of hClC‐Kb‐GFP (left panel) or hClC‐Kb‐myc (right panel) in HEK‐293 cells incubated with 20 μm MG‐132 for different time periods (0∼8 h) were detected by anti‐CLCNKB antibody. The protein level in different time points was standardized to the level at 8 h. The rate of hClC‐Kb protein accumulation induced by MG‐132 was compared between hClC‐Kb‐GFP and hClC‐Kb‐myc. C, comparison of the protein expression and membrane insertion of the hClC‐Kb channel in the absence (+ EV) or presence (+ barttin) of barttin. The surface density of hClC‐Kb was estimated by the ratio of biotin‐labelled hClC‐Kb (biotin‐ClC‐Kb, only multimer form present) and hClC‐Kb in total cell lysate (lysate‐ClC‐Kb, both monomer and multimer forms present). D, I–V relationship curves of wild‐type (WT) hClC‐Kb channels with or without co‐expression of barttin. The current measured in cells transfected with empty vector was designated as blank. The configuration of ruptured symmetrical whole‐cell recording of chloride current and representative currents from hClC‐Kb, hClC‐Kb + barttin and mock‐transfected cells are shown. Gels shown are representatives of three experiments with similar results. The abundance of each band in the gel was measured by densitometry by Image J. * P < 0.05 by unpaired two‐tailed Student's t test. [Color figure can be viewed at wileyonlinelibrary.com]
