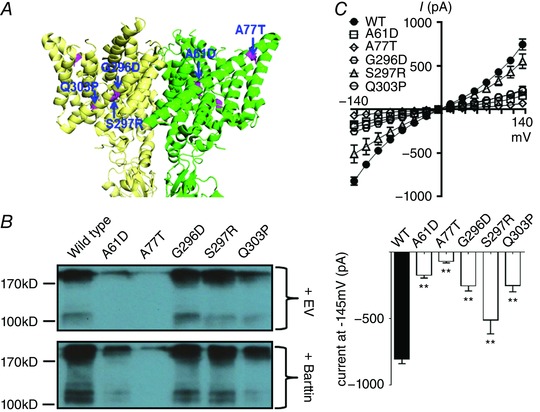
Figure 2. CLCNKB mutations in the barttin‐interacting zone.

A, locations of the mutations (highlighted in magenta) in α‐helix B in the green subunit and α‐helix J in the yellow subunit. The homology model of hClC‐Kb based on a eukaryotic CLC transporter (PDB ID: 3ORG) shows the lateral view of two subunits. B, protein expression of wild‐type versus mutant hClC‐Kb channel [upper blot, total transfected plasmids were balanced by empty vector (EV)], and the responses to barttin co‐expression (lower blot). Gel shown is representative of three experiments with similar results. C, I–V relationship curves of wild‐type (WT) and mutant hClC‐Kb channels with barttin co‐expression (upper graph). The bar graph represents the wild‐type and mutant hClC‐Kb current (pA) at holding potential −145 mV (mean ± SEM, n ≥ 6 for each). ** P < 0.01 between wild‐type and each mutation by unpaired two‐tailed Student's t test.
