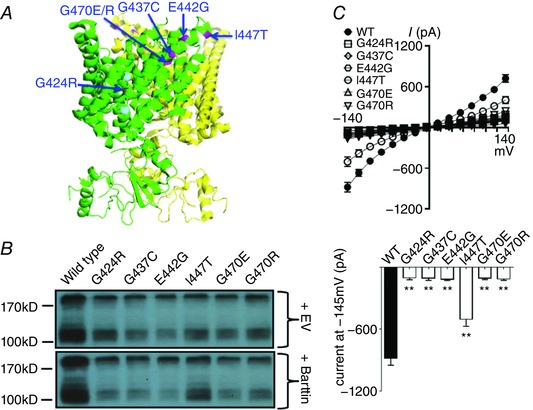
Figure 4. CLCNKB mutations around the selectivity filter.

A, locations of the mutations (highlighted in magenta) in or around the selectivity filter in oblique view with green subunit in front (PDB ID: 3ORG). B, Western blot of wild‐type versus mutant hClC‐Kb channel in the absence (+ EV) or presence (+ Barttin) of barttin co‐expression. C, I–V relationship curves (upper graph) and current at holding potential of −145 mV (lower graph) of wild‐type (WT) and mutant hClC‐Kb channels with barttin co‐expression (mean ± SEM, n ≥ 6 for each). ** P < 0.01 between wild‐type and each mutation by unpaired two‐tailed Student's t test.
