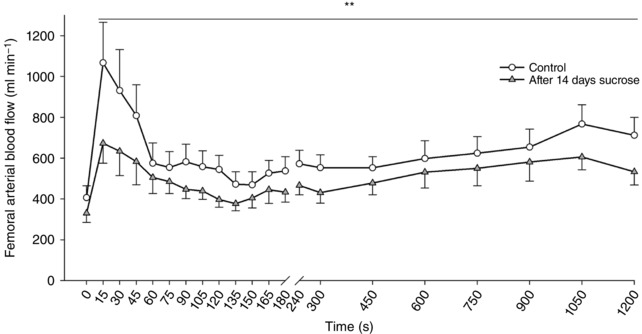
Figure 1. Femoral arterial blood flow during rest and passive leg movement.

Blood flow response to 20 min of passive leg movement under control conditions (open circles) and after 2 weeks of high sucrose intake (grey triangles). Data are presented as the mean ± SD (n = 12). **Overall significant effect of the sucrose intervention compared to the control condition.
