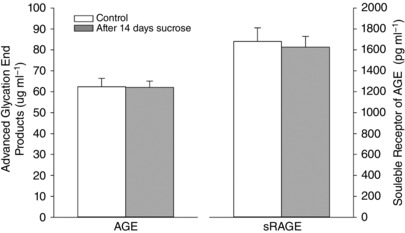
Figure 6. Plasma concentrations of AGE and sRAGE before and after 14 days of sucrose intervention.

Plasma concentration of AGE and sRAGE collected at rest. Data are presented as the mean ± SD (n = 12). There was no significant effect of the sucrose intervention on AGE and sRAGE levels.
