
Figure 2. Impact of TRPC4/5 activation on normal granule cells.
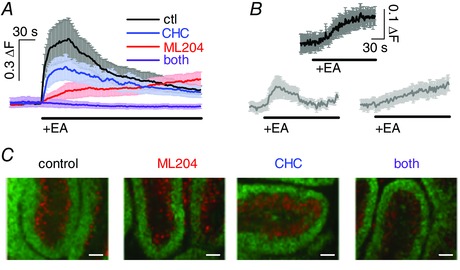
A, graph showing average fluorescence signal (±SEM) in primary granule cells (DIV1/2) in response to application of 10 μm (−)englerin A (EA) under control (ctl) conditions (black), in the presence of 10 μm CHC (blue), ML204 (red), or both (purple); n = 17–88 granule cells . ΔF, fluorescence ratio (see Methods). B, fluorescence signals in response to application of 10 μm (−)EA in granule cells migrating through the molecular layer (top; n = 4), and resident in the internal granule cell layer (bottom) in acute sagittal cerebellar slices; responses were separated by response kinetics into fast (left; n = 9) and slow responders (right; n = 6). C, organotypic cerebellar slices after 14 days of culturing under control conditions (culture medium only), and in the presence of 10 μm ML204, 10 μm CHC, or both. Antibodies against NeuN label postmitotic granule cells (green); antibodies against calbindin label Purkinje cells (red). Scale bars are 0.1 mm.