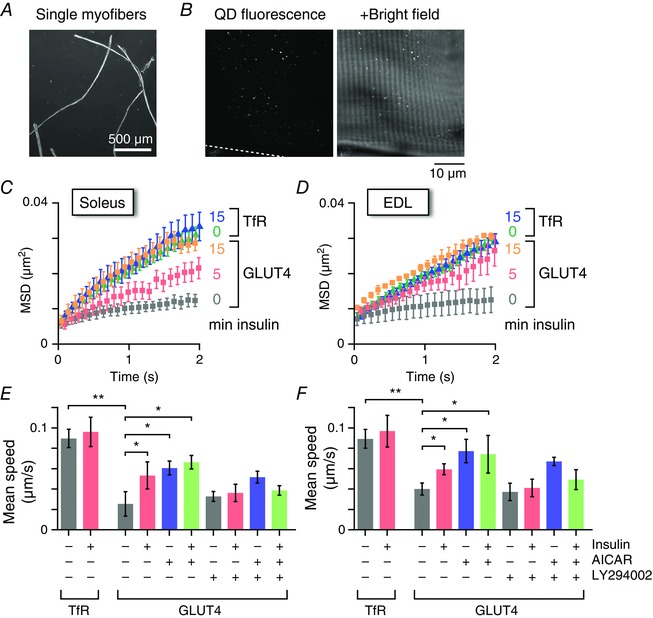
Figure 1. Single molecule nanometry in isolated mouse skeletal myofibres.

A, micrograph of isolated EDL myofibres. B, fluorescence (left) and overlaid bright field (right) images of an EDL myofibre isolated from a myc‐GLUT4‐EGFP transgenic mouse and then labelled with QD655‐conjugated anti‐myc antibodies. C and D, mean MSD curves of intracellular movements of GLUT4 or TfR before and after insulin stimulation (100 nm; 5 or 15 min) in soleus (C) and EDL (D) myofibres. E and F, mean speed of intracellular movement of GLUT4 or TfR under the indicated conditions. Some myofibres were pretreated with LY294002 (50 μm) for 30 min before stimulation with insulin (100 nm) or AICAR (1 mm) for 5 min. * P < 0.05, * * P < 0.01 (n = 4–6).
