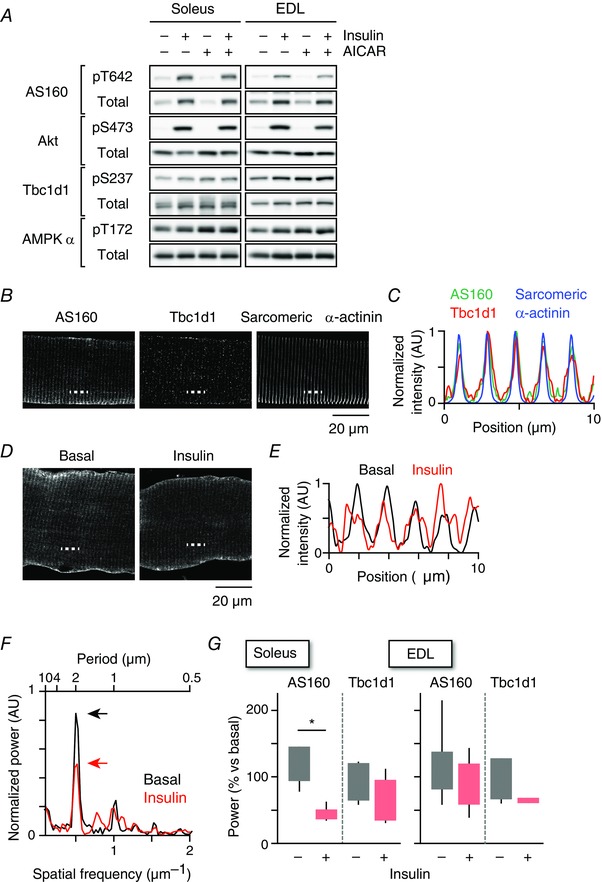
Figure 2. Proximal signalling and localization of AS160 and Tbc1d1.

A, western blotting analyses of proximal signalling related to GLUT4 translocation. B, immunofluorescence images of AS160, Tbc1d1 and sarcomeric α‐actinin in EDL myofibres. C, intensity profiles of AS160 (green), Tbc1d1 (red) and sarcomeric α‐actinin (blue) along the dashed line shown in (B). D, immunofluorescence images of AS160 before and after insulin stimulation (100 nm, 15 min) in soleus myofibre. E, intensity profiles of AS160 before (black) and after (red) insulin stimulation along the dashed line in (D). F, power spectra calculated from the images shown in (D) by 2D‐FFT before (black) and after (red) insulin stimulation. G, quantification of changes in stripe‐like structures of AS160 and Tbc1d1 after insulin stimulation in soleus (left) and EDL (right) myofibres. * P < 0.05 (n = 6).
