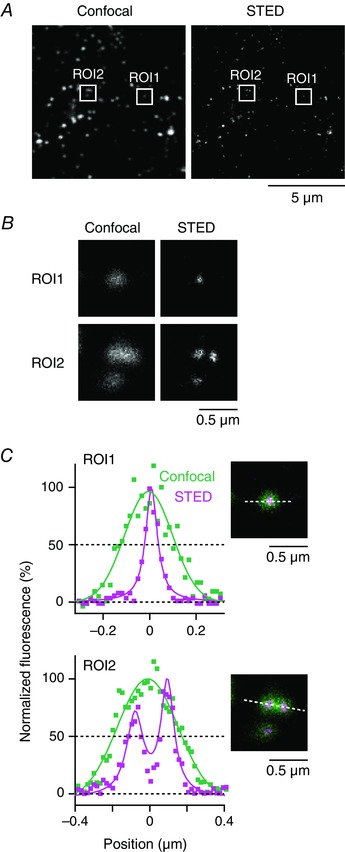
Figure 3. Comparison of confocal and STED images of GLUT4‐containing structures.

A, confocal (left) and STED (right) images of endogenous GLUT4 in EDL muscle. These images were obtained from the same region with the same acquisition setting, except for the excitation/STED laser power. B, magnified images of boxed region‐of‐interest (ROI) in (A). C, intensity profiles of confocal (green) and STED (magenta) images along the dashed line of each ROI (inset). Continuous lines represent Gaussian (confocal) or Lorentzian (STED) fitting of the profiles. In ROI1, FWHM diameters are 243 nm (confocal) and 62 nm (STED), respectively. In ROI2, the intensity profile obtained from the confocal image was best‐fitted with a single Gaussian function for which the FWHM diameter is 384 nm, whereas that from the STED image was best‐fitted with a sum of two Lorentzian functions for which the FWHM diameters are 108 and 85 nm with an interpeak spacing of 173 nm.
