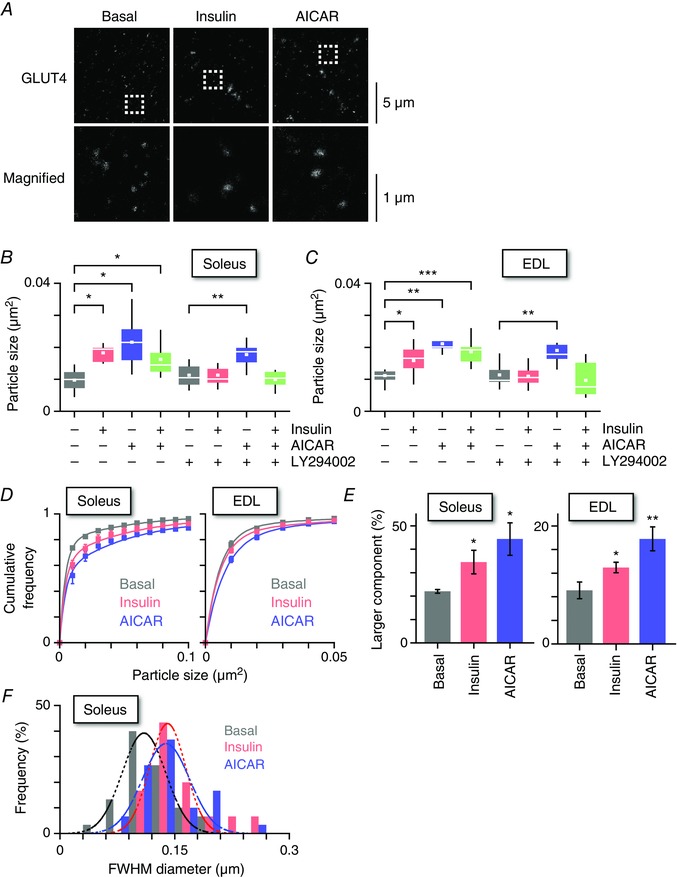
Figure 4. Brief insulin stimulation enlarges GLUT4‐containing structures in myofibres.

A, STED images of endogenous GLUT4 in soleus myofibres of wild‐type mice (upper) and magnified images of boxed regions (lower) in the basal state (left) and after 5 min of insulin (middle, 100 nm) or AICAR (right, 1 mm) stimulation. Box plots of the particle sizes are shown under the indicated conditions in soleus (B) and EDL (C) myofibres. Some myofibres were pretreated with LY294002 (50 μm) for 30 min before stimulation with insulin (100 nm) or AICAR (1 mm) for 5 min. The white line and the square represent median and mean values, respectively. * P < 0.05, * * P < 0.01, * * * P < 0.01 (n = 7–11). D, distributions of GLUT4‐containing structures in the basal state (grey) and after 5 min of insulin (red, 100 nm) or AICAR (blue, 1 mm) stimulations in soleus (left) and EDL (right) muscles. Smooth lines are double‐exponential curves that are characterized by smaller (0.441 × 10⁻² μm2) and larger (5.43 × 10⁻² μm2) components. E, fractions of the larger component of GLUT4‐containing structures in the basal state (grey) and after 5 min of insulin (red, 100 nm) or AICAR (blue, 1 mm) stimulations in soleus (left) and EDL (right) muscles. * P < 0.05, * * P < 0.01 (n = 4–9). F, FWHM diameters of GLUT4‐containing vesicles in soleus myofibres in the basal state (black) and after 5 min of insulin (red, 100 nm) or AICAR (blue, 1 mm) stimulation. Dashed lines represent Gaussian fitting of the histograms for each treatment condition. Median diameters in the basal, insulin and AICAR‐stimulated conditions were 0.115, 0.138 and 0.133 μm, respectively.
