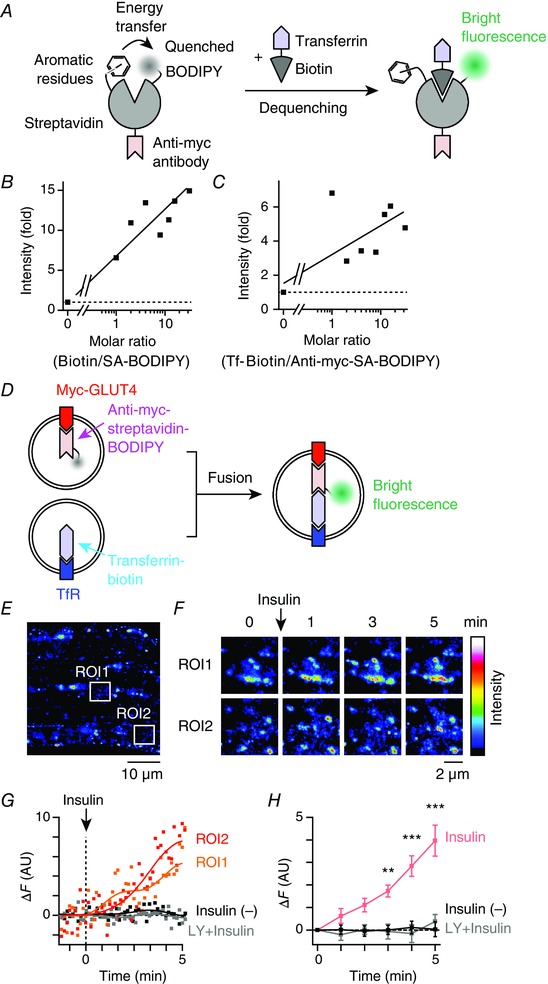
Figure 7. Brief insulin stimulation induces fusion of GLUT4‐containing vesicles with TfR‐containing vesicles in myofibres.

A, schema for the proposed mechanism of BODIPY fluorescence dequenching by biotin binding to streptavidin. In the absence of biotin binding, BODIPY fluorescence is quenched as a result of aromatic residues of streptavidin. B, enhancement of streptavidin‐BODIPY fluorescence in the presence of biotin in vitro. Continuous line represents linear regression of the data. C, enhancement of anti‐myc‐streptavidin‐BODIPY fluorescence in the presence of transferrin‐biotin in vitro. Continuous line represents linear regression of the data. D, schema for the fusion experiments. Prior to stimulation, myc‐GLUT4‐EGFP and TfR were labelled with anti‐myc‐streptavidin/BODIPY and transferrin‐biotin, respectively. After myc‐GLUT4‐EGFP‐containing vesicles fuse with TfR‐containing vesicles, biotin‐streptavidin binding dequenches BODIPY fluorescence, such that increases in green fluorescence can be observed. E, fluorescence image of myc‐GLUT4‐EGFP + anti‐myc‐streptavidin/BODIPY in EDL myofibres of myc‐GLUT4‐EGFP transgenic mouse. F, changes in green fluorescence of boxed regions in (E). Images are the maximum intensity projections of five successive frames. G, time courses of changes in green fluorescence (ΔF) of boxed regions in (E). Myofibres were stimulated with insulin (100 nm) at time 0. For comparison, ΔF is shown in myofibres pretreated with LY294002 (50 μm) for 30 min (grey), as well as in non‐stimulated myofibres (black). Continuous lines represent fast Fourier transform filter smoothing curves. H, mean changes in green fluorescence in the insulin‐stimulated myofibres (red), those pretreated with LY294002 (50 μm) for 30 min (grey) and non‐stimulated myofibres (black). * * P < 0.01, * * * P < 0.001 vs. before stimulation (t = 0, n = 4).
