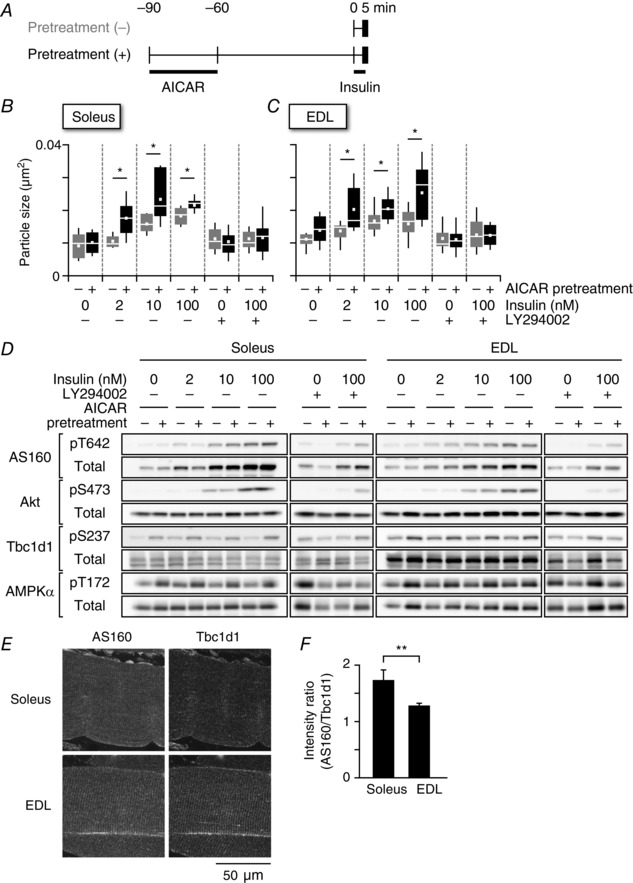
Figure 8. Sequential stimulations with insulin after AICAR treatment enhanced insulin sensitivity in myofibres.

A, treatment protocols for analysing the effects of AICAR pretreatment (1 mm) on the sizes of GLUT4‐containing structures. Box plots of the particle sizes of endogenous GLUT4‐containing vesicles are shown under the indicated conditions in soleus (B) or EDL (C) myofibres. Some myofibres were pretreated with LY294002 (50 μm) prior to the 30 min of insulin stimulation (0–100 nm) for 5 min. The white line and square represent median and mean values, respectively. * P < 0.05 (n = 7–11). D, western blotting analyses of protein phosphorylation and expression under the indicated conditions. E, immunofluorescence images of AS160 (left, green on the right) and Tbc1d1 (middle, magenta on the right) in soleus (upper) and EDL (lower) muscles. F, fluorescence intensity ratios of AS160 to Tbc1d1 in soleus and EDL myofibres. * P < 0.05 (n = 5).
