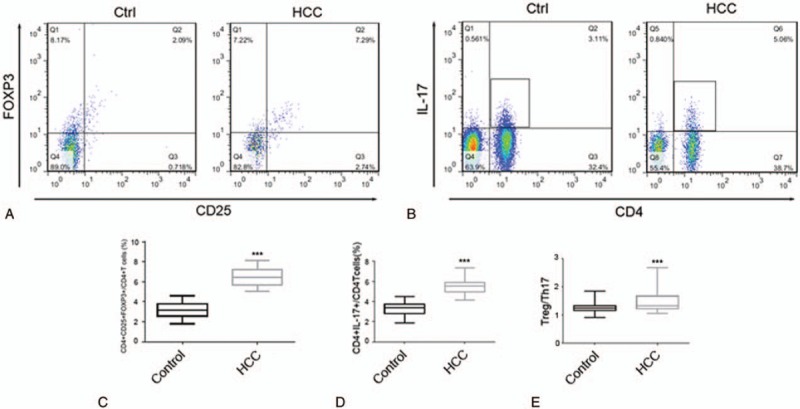
Figure 1.

Treg and Th17 levels and the Treg/Thl7 ratio in the control group (Control) and HCC group (HCC). (A) Flow cytometric analysis of the CD4+CD25+FOXP3+ Treg cell levels in the control and HCC groups. (B) Flow cytometric analysis of the CD4+IL-17+ Th17 cell levels in the control and HCC groups. (C) The proportion of CD4+CD25+FOXP3+ Treg cells out of all CD4+ T cells in the control and HCC groups. (D) The proportion of CD4+IL-17+ Th17 cells out of all CD4+ T cells in the control and HCC groups. (E) The Treg/Th17 ratio in the control and HCC groups (∗P < .05,†P < .01,‡P < .001).
