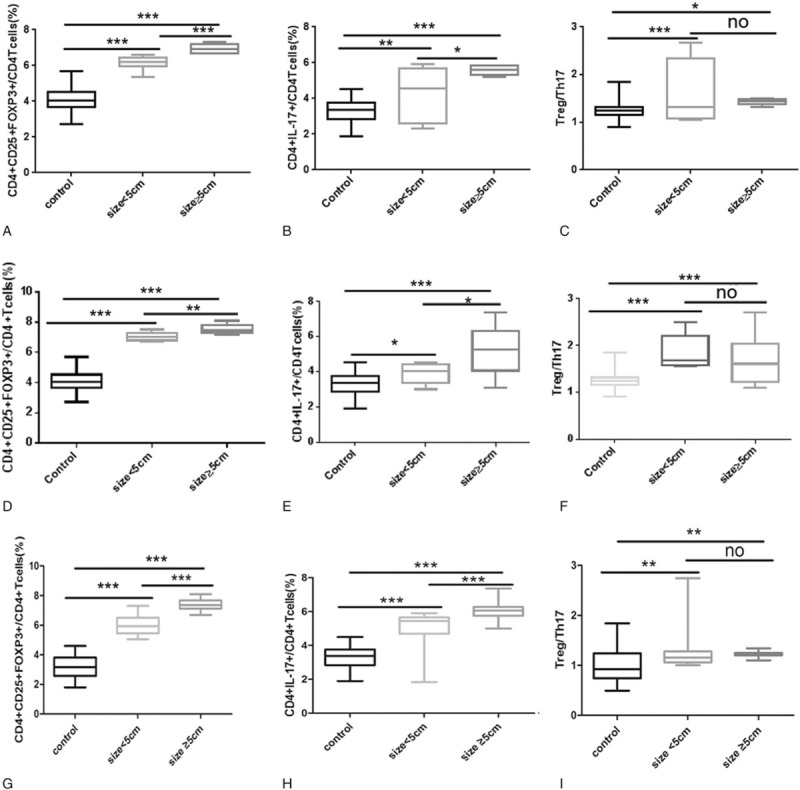
Figure 3.

Treg and Th17 levels and the Treg/Th17 ratio in the control group (Control), the small tumor size HCC group (size < 5 cm), and the large tumor size HCC group (size ≥5 cm). (A) The proportion of CD4+CD25+FOXP3+ Treg cells out of all CD4+ T cells in the control, size < 5 cm (early stage I-II) and size ≥5 cm (early-stage I-II) groups. (B) The proportion of CD4+IL-17+ Th17 cells out of all CD4+ T cells in the control, size <5 cm (early-stage I-II) and size ≥5 cm (early-stage I-II) groups. (C) The Treg/Th17 ratio in the control, size <5 cm (early stage I-II) and size ≥5 cm (early-stage I-II) groups. (D) The proportion of CD4+CD25+FOXP3+ Treg cells out of all CD4+ T cells in the control, size <5 cm (advanced-stage III-IV) and size ≥5 cm (advanced-stage III-IV) groups. (E) The proportion of CD4+IL-17+ Th17 cells out of all CD4+ T cells in the control, size <5 cm (advanced-stage III-IV) and size≥5 cm (advanced-stage III-IV) groups. (F) The Treg/Th17 ratio in the control, size<5 cm (advanced-stage III-IV) and size≥5 cm (advanced-stage III-IV) groups. (G) The proportion of CD4+CD25+FOXP3+ Treg cells out of all CD4+ T cells in the control, size<5 cm and size≥5 cm groups. (H) The proportion of CD4+IL-17+ Th17 cells out of all CD4+ T cells in the control, size<5 cm and size≥5 cm groups. (I) The Treg/Th17 ratio in the control, size<5 cm and size≥5 cm groups (“no” refers to P > .05,∗P < .05,†P < .01,‡P < .001).
