Supplemental Digital Content is available in the text
Keywords: differentially expressed genes, functional enrichment analysis, hub genes, nonalcoholic fatty liver disease, protein–protein interaction network
Abstract
Background:
Nonalcoholic fatty liver disease (NAFLD) is the most common chronic liver condition worldwide. However, its etiology and fundamental pathophysiology for the disease process are poorly understood. In this study, we thus used bioinformatics to identify candidate genes potentially causative of severe NAFLD.
Methods:
Gene expression profile data GSE49541 were downloaded from the Gene Expression Omnibus database. Tissues samples from 32 severe and 40 mild NAFLD patients were evaluated to identify differentially expressed genes (DEGs) between the 2 groups, followed by analyses of Gene Ontology (GO) functions and Kyoto Encyclopedia of Genes and Genomes pathways. Then, a weighted protein–protein interaction (PPI) network was constructed, and subnetworks and candidate genes were screened. Moreover, the GSE48452 data (14 normal liver tissue samples and 18 nonalcoholic steatohepatitis samples) were used to verify the results obtained from the above analyses.
Results:
A total of 100 upregulated genes and 24 downregulated ones were identified in severe NAFLD. Functional enrichment and pathway analyses showed that these DEGs were mainly associated with cell adhesion, inflammatory response, and chemokine activity. The top 5 subnetworks were selected based on the PPI network. A total of 5 hub genes, including ubiquilin 4 (UBQLN4), amyloid-beta precursor protein (APP), sex hormone–binding globulin (SHBG), cadherin-associated protein beta 1 (CTNNB1) and collagen type I alpha 1 (COL1A1), were considered to be candidate genes for NAFLD. In addition, the verification data confirmed the status of COL1A1, SHBG, and APP as candidate genes.
Conclusion:
UBQLN4, APP, CTNNB1, SHBG, and COL1A1 might be involved in the development of NAFLD, and are proposed as the potential markers for predicting the development of this condition.
1. Introduction
Nonalcoholic fatty liver disease (NAFLD) is the most common chronic liver condition worldwide.[1] Its incidence is as high as 30% in developed countries and nearly 10% in developing countries.[2] NAFLD is a clinicopathologic syndrome that encompasses several clinical entities, ranging from simple steatosis to steatohepatitis, fibrosis, and end-stage liver disease.[3] Because the etiology and fundamental pathophysiology underlying NAFLD are poorly understood,[4] it is challenging to diagnose and treat NAFLD patients before symptomatic cirrhosis or arises.
Gene expression profiling is considered as a powerful tool for exploring diagnostic and predictive biomarkers, especially in the targeting therapy for diseases such as cancer.[5,6] In a previous study, the differences in expression of the transcriptome and proteome in the liver between NAFLD and normal were determined using a gene expression profile, and several key pathways involved xenobiotic and lipid metabolism, inflammatory response, and cell-cycle control were identified.[7] A study on the differential gene expression in nonalcoholic steatohepatitis (NASH) also showed that the uptake transporter genes were coordinately targeted for downregulation at the global level during the pathological development of NASH.[8] In addition, using microarray analysis, Moylan et al[9] indicated that the expression of certain metabolism-related genes was induced in severe NAFLD. Although many genes have been reportedly related to the process of NAFLD development, candidate genes potentially causative of severe NAFLD have not yet been screened, and it has remained unclear whether such genes induce severe NAFLD by interacting with each other.
Against the above background, the present study involved an exploration of the candidate genes of NAFLD, the establishment of a weighted regulatory network and the mining of hub genes in severe NAFLD samples compared with mild NAFLD samples were explored by using bioinformatic methods. We aimed to provide molecular mechanisms underlying NAFLD, and investigate new therapeutic targets of NAFLD.
2. Materials and methods
2.1. Samples
Gene expression profile data GSE49541[9] were downloaded from Gene Expression Omnibus (GEO) database (http://www.ncbi.nlm.nih.gov/geo/) with platform GPL570 (HG-U133_Plus_2) Affymetrix Human Genome U133 Plus 2.0 Array. Data on 72 tissue samples were downloaded, including those from 32 severe NAFLD patients (fibrosis stages 3–4) and 40 mild NAFLD patients (fibrosis stage 0–1). The groups were matched for sex, age (±5 years) and body mass index ( kg/m2) (±3 points). The samples were collected from NAFLD cases in the Duke University Health System NAFLD Biorepository, with approval from the Institutional Review Board of Duke University. Biorepository liver samples are remnants from clinically indicated liver biopsies.
2.2. Data preprocessing and differential expression analysis
The normalization of gene expression profile data was performed using the Robust Multichip Averaging (RMA) method[10] of the affy package[11] in R (v.3.0.0) (http://bioconductor.org/biocLite.R), and the Linear Models for Microarray Data (limma, http://www.bioconductor.org/packages/release/bioc/html/limma.html) package[12] was applied to identify the differentially expressed genes (DEGs) by comparing the gene expression levels in samples between mild and severe NAFLD cases. Resampling-based empirical Bayes multiple testing procedures[13] were also conducted to correct the P value. Subsequently, an adjusted P value <.05 and |logFC (log fold change)| >0.58 were selected as the thresholds for DEG screening.
2.3. Gene Ontology annotation and pathway analysis
The Database for Annotation, Visualization, and Integrated Discovery (DAVID)[14] (http://david.abcc.ncifcrf.gov/) is a tool for the functional classification of genes that provides a comprehensive set of functional annotation tools enabling investigators to understand the biological meaning behind large lists of genes. Here, DAVID was used for GO annotation analysis (including the 3 categories of biological process, cellular component, and molecular function 3 aspects) and Kyoto Encyclopedia of Genes and Genomes (KEGG) pathway analysis. A P value <.05 was considered to indicate a significant difference.
2.4. Weighted regulatory network construction
The protein–protein interactions (PPIs) that were related to genes in GSE49541 were selected according to the Human Protein Reference Database (HPRD, (http://www.hprd.org/).[15] The average value of rank correlation coefficient 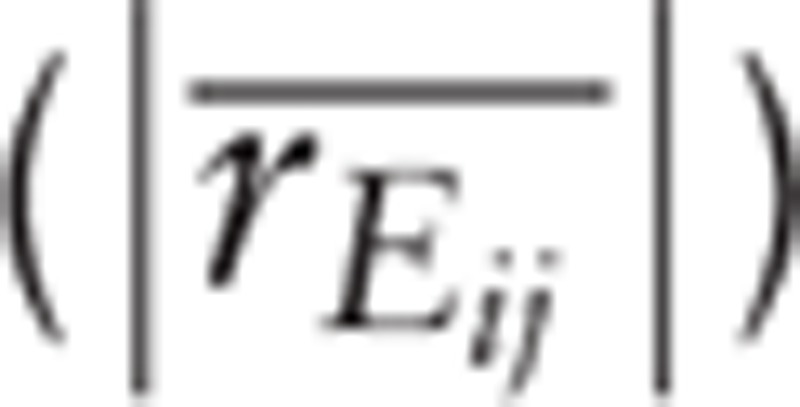 and the difference
  for pairs of regulatory relationship in PPIs were calculated according to the Eq. (1). The average absolute value of the rank correlation coefficient in control samples was considered as the weight of PPI,[16] and then the weighted PPI network was constructed.
Here, Eij is the edge between gene Vi and gene Vj, k is the kth sample, Vi and Vj are ranked by their expression in the samples, respectively; Xjk is the rank of Vi of kth sample, Xik is the rank of Vj of kth sample, xj and xj are the average rank s of Vi and Vj in the samples, respectively.
Here, rEij1 and rEij2 represent the Spearman coefficients of rEij1 in 2 samples, respectively.
Finally, based on the permutation test, the random  of each PPI was calculated. Subsequently, the sample labels were permuted for 10,000 times and a random
 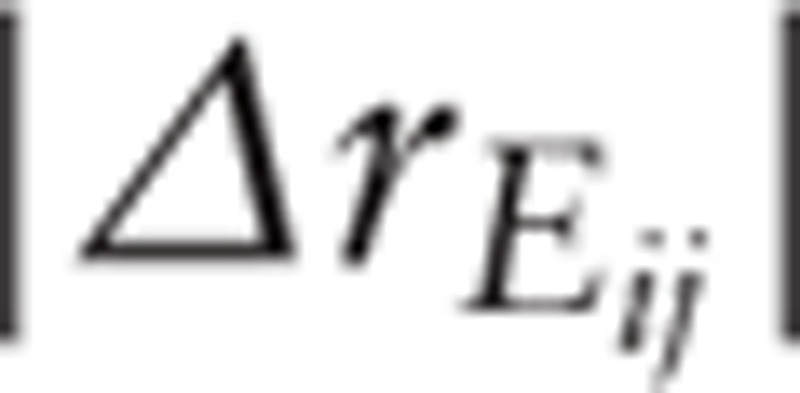 was generated. The PPIs with a
 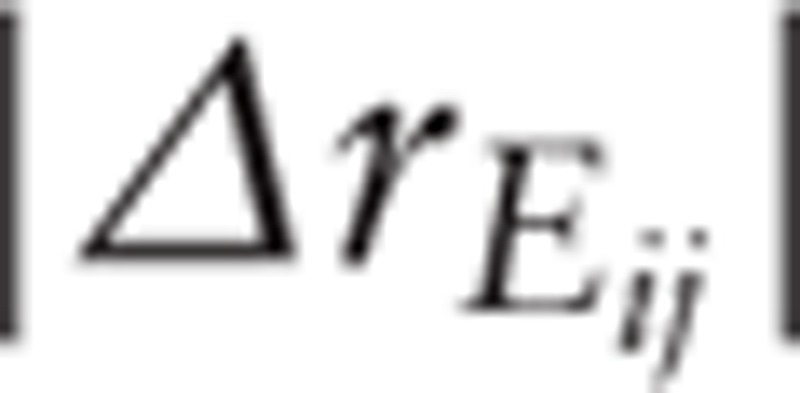 value >90% random
  value were filtered out.[16]
2.5. Subnetwork investigation and protein–protein interaction score calculation
In the PPI network, the nodes with a degree >15 were defined as candidate genes potentially causative of disease, and the subnetworks consisted of candidate genes and the genes with which they interact. The score of PPIs in the subnetworks were also calculated. Briefly, all PPIs in the weighted network were ranked from large to small according to their weight coefficient and this was defined as the background set (E), whereas the subnetwork was defined as the objective set (S). Then, the enrichment score (ES) of the subnetwork was calculated by walking down background set using the Gene Set Enrichment Analysis method[17] (http://www.broadinstitute.org/gsea/index.jsp). The formula is listed as below:
 |
where Ej is the jth PPI in the ranked regulatory pairs; rj is the weight of the jth PPI pair in background set; P is a parameter and set as 1; N is the number of PPI in E; NH is the number of PPI in the subnet S. The ES was equal to the maximum deviation between Phit and Pmiss.
The PPI without contribution to ES was removed from subnetwork.[16,17] To estimate the significance of ES of the subnetwork, pairs of background regulatory relationships were rearranged randomly for 1000 times, the random ES of subnetwork was calculated, while the ES was transformed into Z value based on the equation[16]:
where ES (bar) is the mean of the random ES set and S′ is the standard deviation of the random ES set.
2.6. Calculating the enrichment score of differentially expressed genes in subnetwork
On the basis of the subnetwork obtained above, the ES of DEGs were calculated. Briefly, the genes in gene microarray and subnetwork were considered as background set and objective set, respectively; then, these genes were arranged from large to small; the ES of subnetwork walked by background set was calculated using the following equation[16]:
 |
Here, gj is the jth gene in the ranked genes, rj is the magnitude of differential expression of the jth gene, P is a parameter and set as 1, M is the number of genes in L, and MH is the number of genes in Strimmed.
To estimate the significance of ES of the subnetwork, the background genes were rearranged randomly for 1000 times. The random ES of the subnetwork was calculated, followed by the ES being transformed into a Z value based on the Eq. (5).
2.7. Candidate genes screening
The 2 Z values obtained as described above were normalized and summed, followed by the acquisition of the combined these 2 parts. Here, using this combined score, the top 5 subnetworks were considered as candidate subnetworks of the disease, whereas the hub genes were defined as candidate genes of the disease.[16]
2.8. Data verification
Gene expression profile data GSE48452 were downloaded from the GEO database (http://www.ncbi.nlm.nih.gov/geo/) with the platform (HuGene-1_1-st) Affymetrix Human Gene 1.1 ST Array [transcript (gene) version], including data on 14 normal liver tissue samples and 18 NASH samples. The liver samples had been obtained from NAFLD patients, who had provided written informed consent. The study protocol was also approved by the institutional review board (“Ethikkommissionder Medizinischen Fakult der University Kiel,” D425/07, A111/99). Empirical Bayes analysis using t test procedures in the limma package (Version 3.10.3, http://www.bioconductor.org/packages/2.9/bioc/html/limma.html) was applied to identify the DEGs by comparing gene expression levels between normal and NASH samples. Subsequently, an adjusted P value <.05 and |logFC| >0.58 were selected as the significance thresholds for DEGs. Subsequently, the Pearson correlation analysis was performed to confirm the differences between the key candidate genes in severe NAFLD and the target DEGs with which they interacted.
3. Results
3.1. Identification of differentially expressed genes
The gene expression profile data were normalized by using the RMA method (Fig. 1). Upon applying the thresholds of an adjusted P value <.05 and |logFC| >0.58, a total of 124 DEGs were identified, including 100 upregulated genes and 24 downregulated ones (Supplementary Table 1). The heatmap of the DEGs is shown in Figure 2. The top 10 upregulated genes and downregulated genes are listed in Table 1.
Figure 1.
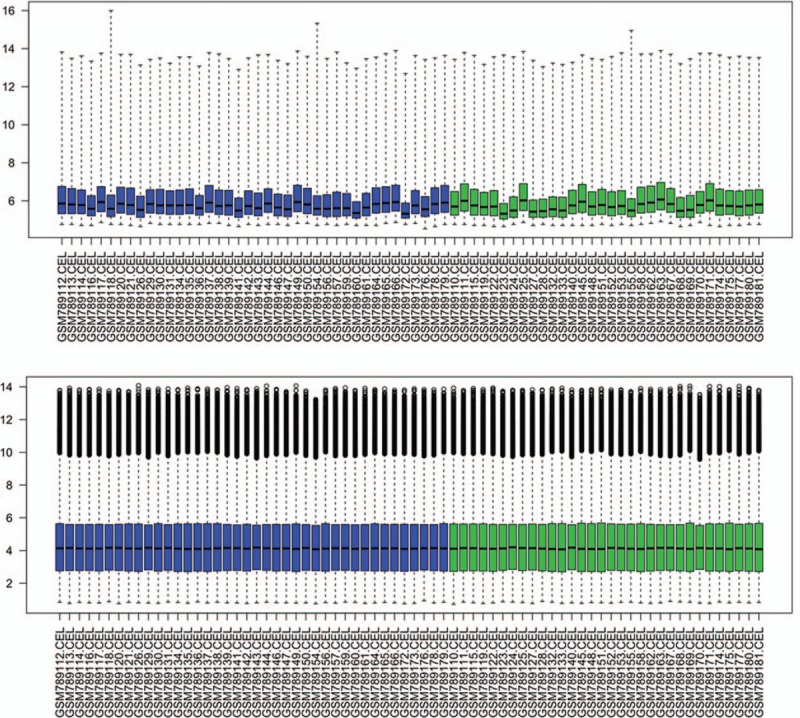
Box plot of gene expression profile data before and after normalization. The top box represents the distribution of data before normalization, and the bottom box represents the distribution of data after normalization. Horizontal axis represents 72 nonalcoholic fatty liver disease samples.
Figure 2.
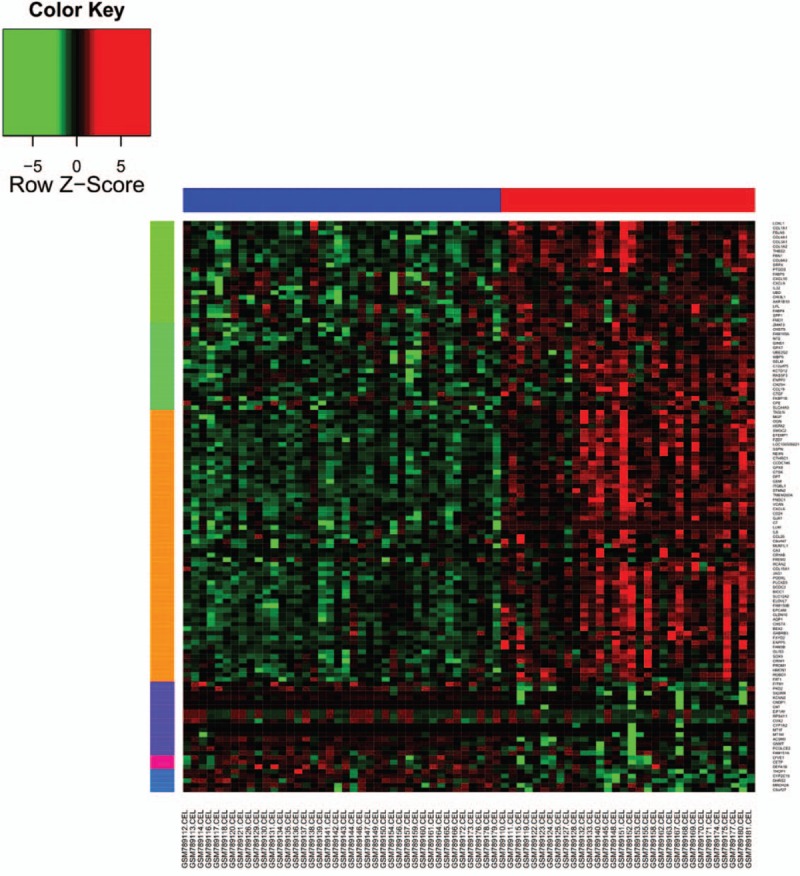
The expression of differentially expressed genes in nonalcoholic fatty liver disease samples. The bottom horizontal axis represents nonalcoholic fatty liver disease samples, the first 40 samples were from mild nonalcoholic fatty liver disease samples and the other 32 samples were from severe nonalcoholic fatty liver disease. The right vertical axis represents genes. Red indicates upregulated genes and green indicates downregulated genes.
Table 1.
The top 10 upregulated and downregulated differentially expressed genes.

3.2. Gene Ontology annotation analysis and pathway analysis
GO annotation analysis of the DEGs was performed by using DAVID, the main results of which are listed in Table 2 (Supplementary Table 2). The biological processes that were particularly commonly associated with NAFLD were cell adhesion, chemotaxis, collagen fibril organization, and inflammatory response; the cellular components were extracellular matrix and collagen; and the molecular function was chemokine activity. Furthermore, the identified DEGs were significantly clustered in cell adhesion and chemokine signaling pathways.
Table 2.
Gene Ontology annotation analysis of differentially expressed genes in 3 aspects.

3.3. Weighted protein–protein interaction network analysis
Based on the HPRD, the PPIs related to genes in the gene microarray were selected, and a PPI network was constructed. The entire network consisted of 8964 nodes and 34,915 edges (Fig. 3).
Figure 3.

The top 5 subnetworks with the highest Z scores. Red spots represent differentially expressed genes, and blue or yellow spots represent nondifferentially expressed genes.
3.4. The enrichment score of subnetwork and candidate genes
By calculating the weighted PPIs of the subnetwork and the score of DEGs, the significance of ES was estimated with Z value. Then, the top 5 subnetworks with the highest Z values were selected (Fig. 4). The corresponding hub genes were considered as candidate genes, which included ubiquilin 4 (UBQLN4), also known as ataxin-1-interacting protein (A1UP), amyloid-beta precursor protein (APP), sex hormone–binding globulin (SHBG), cadherin-associated protein beta 1 (CTNNB1) and collagen type I alpha 1 (COL1A1) (Table 3).
Figure 4.

Pearson correlation analysis between APP and the target-DEGs which they interact. A, the correlation between APP and COL1A2 (R = 0.519, P = .002); B, the correlation between APP and COL4A1 (R = 0.638, P < .001); C, the correlation between APP and CRYAB (R = 0.443, P = .011). R represents Pearson correlation coefficient, R > 0 indicates a positive correlation; R < 0 indicates a negative correlation; if |R| is further away from 0, the correlation is stronger. The P value indicates the significant difference. APP = amyloid-beta precursor protein, DEG = differentially expressed gene.
Table 3.
The candidate genes and their interacted genes.

3.5. The results of verification data
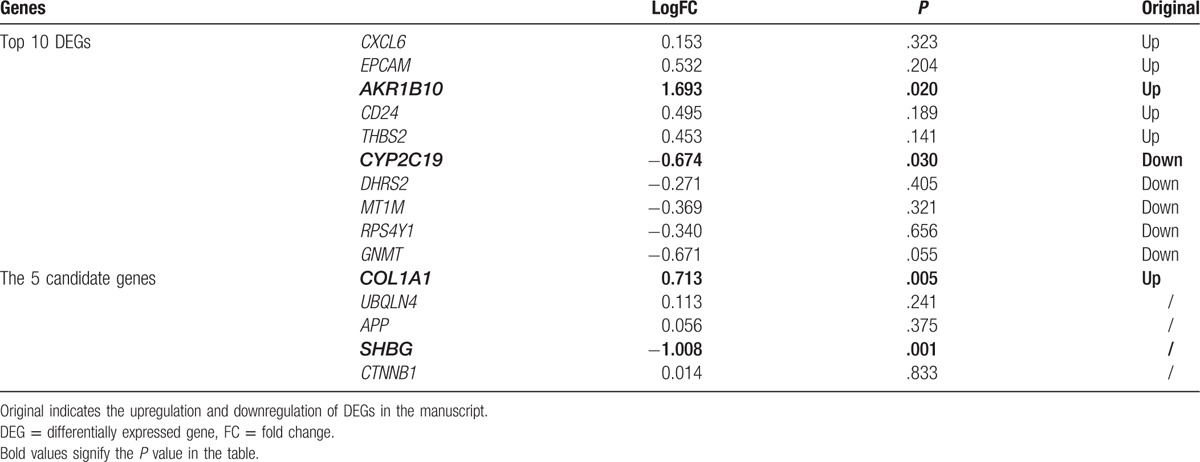
To confirm the above results, the DEGs between normal and NASH samples were identified through data verification. A total of 181 DEGs were identified, including 119 upregulated DEGs and 62 downregulated DEGs (Supplementary Table 3). As shown in Table 4, COL1A1 and SHBG exhibited significant differences in their expression level. AKR1B10 and CYP2C19, which were included in the original top10 DEGs, were also verified. UBQLN4, APP, and SHBG interacted with the target DEGs in the PPI networks. Pearson correlation analysis revealed that there were significant positive correlations between APP and its target-DEGs (COL1A2, CRYAB, COL4A1) (P < .05, Fig. 4A–C).
Table 4.
The results of verification data including the top 10 differentially expressed genes and the 5 candidate genes.
4. Discussion
NAFLD, is an emerging public health problem, that may be a highly chronic liver condition.[1] Although the histologic method has been approved, a useful therapy method for treating NAFLD is yet to be established.[18] Gene expression profiling is valuable for researching diagnostic and predictive biomarkers of disease, including NAFLD,[9] which may facilitate the development of new therapeutic drugs. In the present study, a total of 124 DEGs associated with severe NAFLD were identified by comparing the gene expression profile with that in mild NAFLD. These DEGs were mainly associated with cell adhesion, inflammatory response, and chemokine signaling pathways. Selection of top 5 subnetworks based on the PPI network indicated that UBQLN4, APP, CTNNB1, SHBG, and COL1A1 may be involved in the development of NAFLD, and these were considered to be markers with potential utility for predicating NAFLD.
In a previous study, inflammation was proved to be associated with the process of NAFLD development.[19] Mikolasevic et al[20] demonstrated that in patients maintained on hemodialysis, there is probably some interaction between NAFLD and inflammation, malnutrition, and atherosclerosis. In support of this, a significant correlation between the intima-media thickness of the carotid artery and hepatic inflammation score was identified in NAFLD rats.[21] Moreover, Browning and Horton[22] indicated that the histological hallmarks of NASH, such as inflammation, cell death, and fibrosis promoted the progression of NAFLD. In fact, findings showed that inflammation resulting in a stress response of hepatocytes, might lead to lipid accumulation, and therefore could precede steatosis in NASH.[23] In another study based on gene expression in human cases of NAFLD, Greco et al[19] asserted that cell adhesion was significantly associated with liver fat content. In severe liver injury, neural cell adhesion molecules weaken the cell–cell and cell–matrix interactions, thereby allowing ductular reactions/hepatic progenitor cells to migrate for normal development and regeneration.[24] In fact, each cell adhesion molecule may play an important role during development in hepatic histogenesis, including hepatoblast/hepatocyte-stellate cell interactions.[25] In the present study, the selected DEGs were particularly associated with processes such as cell adhesion and inflammatory response. Thus, we speculated that these biological processes such as cell adhesion, fibrosis, and inflammatory response might play important roles in the development of NAFLD.
COL1A1 has been demonstrated to be upregulated in liver fibrosis by the activation of stellate cells and the progression of liver fibrosis.[26,27] Zhao et al[28] showed that COL1A1 gene polymorphism was associated with liver fibrogenesis, since the T allele at 1997 of COL1A1 was crucial to the increased transcriptional activity. COL1A2 is an independent predictor of survival in diseases.[29] Many diseases that are inherited in an autosomal dominant fashion are caused by mutations in the COL1A1/COL1A2 genes.[30,31] Because COL1A1 and COL1A2 were revealed to be DEGs associated with NAFLD in this study, we speculated that not only COL1A2, but also the dysregulation of COL1A1/COL1A2 participated in the progression of NAFLD. Furthermore, the present study based on GO and KEGG pathway analyses showed that COL1A1 might be related to cell adhesion and inflammation; thus, COL1A1/COL1A2 might play important roles in diseases by regulating genes associated with cell adhesion and inflammation. In addition, COL1A1 was confirmed to be upregulated in NASH samples compared with the level in normal controls. SHBG, a glycoprotein expressed predominantly in the hepatocytes, regulates the transport of sex steroid hormones in the bloodstream to their target tissues.[32] As one of the circulation factors released from fatty liver, SHBG was reported to be directly involved in the pathogenesis of local and systemic inflammation, and peripheral as well as hepatic insulin resistance.[33] In the present study, APP and SHBG were shown to be connected by COL1A2, which further indicates that the APP and SHBG genes have a close relationship in the process of NAFLD development.
Ubiquilins (UBQLN), a family of ubiquitin-binding proteins, are involved in several protein degradation pathways and have been implicated in various diseases.[34] Previous studies indicated that the members of this family-mediated degradation of misfolded proteins and they were implicated in a number of pathological and physiological conditions.[34–36] For example, Matsuda et al[37] indicated that UBQLN4 was highly expressed in organs such as liver. Unfortunately, to date, few details of the relationship between UBQLN4 and NAFLD have been clarified. In this study, UBQLN4 was revealed to be a hub gene in the PPI network. Thus, we speculated that UBQLN4 might participate in the progression of via the degradation of misfolded proteins. CTNNB1 is located on the short arm of chromosome 3, as determined by in situ fluorescence analysis,[38] and has been reported to be commonly involved in benign liver tumorigenesis.[39] Mutation of the CTNNB1 gene mutation is also an important indicator of prognosis in primary sporadic aggressive fibromatosis.[40] In addition, CTNNB1 was also found to often display point mutations resulting in loss of function in a range of cancers, with the notable exception in hepatocellular carcinoma,[41] revealing that the expression level of CTNNB1 might have great significance for liver function. Kubota et al[42] indicated that mutational analysis of CTNNB1 for predicting disease such as solid-pseudopapillary neoplasm is feasible. In the present study, CTNNB1 investigated given its status here as a hub protein. The findings suggest that CTNNB1 is useful as a target gene for further investigation of NAFLD. The analyses demonstrated the detailed action of these 2 candidate genes in NAFLD, and also showed that the interaction between them is rare. Therefore, further experiments are needed to explain the functions of CTNNB1 and UBQLN4 in NAFLD.
Despite all these results, there are some limitations in the present study. First, verification experiments were not performed because of the lack of sufficient liver tissue samples. Second, we did not obtain the gene expression data, including for normal liver tissue, severe NAFLD tissue, and mild NAFLD tissue, categorized according to fibrosis stage in the NCBI database. Therefore, more experiments and data are required to verify the above results.
In conclusion, cell adhesion, fibrosis, and inflammatory response might play crucial roles in severe NAFLD. Similarly, 5 candidate genes, namely UBQLN4, APP, CTNNB1, SHBG, and COL1A1 might be involved in the development of NAFLD, and might be considered as potential markers for predicting the development of NAFLD. The findings of this study might explain the development of NAFLD and reveal new target genes for treating NAFLD.
Supplementary Material
Supplementary Material
Supplementary Material
Footnotes
Abbreviations: APP = amyloid-beta precursor protein, COL1A1 = collagen type I alpha 1, CTNNB1 = cadherin-associated protein beta 1, DAVID = The Database for Annotation, Visualization, and Integrated Discovery, DEG = differentially expressed gene, ES = enrichment score, FC = fold change, GEO = Gene Expression Omnibus, GO = Gene Ontology, HPRD = Human Protein Reference Database, KEGG = Kyoto Encyclopedia of Genes and Genomes, NAFLD = Nonalcoholic fatty liver disease, NASH = nonalcoholic steatohepatitis, PPI = protein–protein interaction, RMA = Robust Multichip Averaging, SHBG = sex hormone-binding globulin, UBQLN4 = ubiquilin 4.
The authors have no conflicts of interest to disclose.
Supplemental Digital Content is available for this article.
References
- [1].Erickson SK. Nonalcoholic fatty liver disease. J Lipid Res 2009;50(suppl):S412–6. [DOI] [PMC free article] [PubMed] [Google Scholar]
- [2].Smith BW, Adams LA. Non-alcoholic fatty liver disease. Crit Rev Clin Lab Sci 2011;48:97–113. [DOI] [PubMed] [Google Scholar]
- [3].Grant LM, Lisker-Melman M. Nonalcoholic fatty liver disease. Ann Hepatol 2004;3:93–9. [PubMed] [Google Scholar]
- [4].Northup PG, Argo CK, Shah N, Caldwell SH. Hypercoagulation and thrombophilia in nonalcoholic fatty liver disease: mechanisms, human evidence, therapeutic implications, and preventive implications. Paper presented at: Thieme Medical Publishers, 2012, 32:39–48. [DOI] [PubMed] [Google Scholar]
- [5].Van’t Veer LJ, Dai H, Van De Vijver MJ, et al. Gene expression profiling predicts clinical outcome of breast cancer. Nature 2002;415:530–6. [DOI] [PubMed] [Google Scholar]
- [6].Emilsson V, Thorleifsson G, Zhang B, et al. Genetics of gene expression and its effect on disease. Nature 2008;452:423–8. [DOI] [PubMed] [Google Scholar]
- [7].Kirpich IA, Gobejishvili LN, Homme MB, et al. Integrated hepatic transcriptome and proteome analysis of mice with high-fat diet-induced nonalcoholic fatty liver disease. J Nutr Biochem 2011;22:38–45. [DOI] [PMC free article] [PubMed] [Google Scholar]
- [8].Lake AD, Novak P, Fisher CD, et al. Analysis of global and absorption, distribution, metabolism, and elimination gene expression in the progressive stages of human nonalcoholic fatty liver disease. Drug Metab Dispos 2011;39:1954–60. [DOI] [PMC free article] [PubMed] [Google Scholar]
- [9].Moylan CA, Pang H, Dellinger A, et al. Hepatic gene expression profiles differentiate pre-symptomatic patients with mild versus severe nonalcoholic fatty liver disease. Hepatology 2014;59:471–82. [DOI] [PMC free article] [PubMed] [Google Scholar]
- [10].Irizarry RA, Hobbs B, Collin F, et al. Exploration, normalization, and summaries of high density oligonucleotide array probe level data. Biostatistics 2003;4:249–64. [DOI] [PubMed] [Google Scholar]
- [11].Gautier L, Cope L, Bolstad BM, et al. Affy—analysis of Affymetrix GeneChip data at the probe level. Bioinformatics 2004;20:307–15. [DOI] [PubMed] [Google Scholar]
- [12].Diboun I, Wernisch L, Orengo CA, et al. Microarray analysis after RNA amplification can detect pronounced differences in gene expression using limma. BMC Genomics 2006;7:252. [DOI] [PMC free article] [PubMed] [Google Scholar]
- [13].Dudoit S, Gilbert HN, Van Der Laan MJ. Resampling-based empirical bayes multiple testing procedures for controlling generalized tail probability and expected value error rates: focus on the false discovery rate and simulation study. Biometr J 2008;50:716–44. [DOI] [PMC free article] [PubMed] [Google Scholar]
- [14].Alvord G, Roayaei J, Stephens R, et al. The DAVID Gene Functional Classification Tool: a novel biological module-centric algorithm to functionally analyze large gene lists. Genome Biol 2007;8:R183. [DOI] [PMC free article] [PubMed] [Google Scholar]
- [15].Prasad TK, Goel R, Kandasamy K, et al. Human protein reference database—2009 update. Nucleic Acids Res 2009;37(suppl 1):D767–72. [DOI] [PMC free article] [PubMed] [Google Scholar]
- [16].Wu C, Zhu J, Zhang X. Integrating gene expression and protein-protein interaction network to prioritize cancer-associated genes. BMC Bioinformatics 2012;13:182. [DOI] [PMC free article] [PubMed] [Google Scholar]
- [17].Subramanian A, Tamayo P, Mootha VK, et al. Gene set enrichment analysis: a knowledge-based approach for interpreting genome-wide expression profiles. Proc Natl Acad Sci USA 2005;102:15545–50. [DOI] [PMC free article] [PubMed] [Google Scholar]
- [18].Mazzella N, Ricciardi LM, Mazzotti A, et al. The role of medications for the management of patients with NAFLD. Clin Liver Dis 2014;18:73–89. [DOI] [PubMed] [Google Scholar]
- [19].Greco D, Kotronen A, Westerbacka J, et al. Gene expression in human NAFLD. Am J Physiol Gastrointest Liver Physiol 2008;294:G1281–7. [DOI] [PubMed] [Google Scholar]
- [20].Mikolasevic I, Lukenda V, Racki S, et al. Nonalcoholic fatty liver disease (NAFLD)—a new factor that interplays between inflammation, malnutrition, and atherosclerosis in elderly hemodialysis patients. Clin Interv Aging 2014;9:1295–303. [DOI] [PMC free article] [PubMed] [Google Scholar]
- [21].Wu J, Zhang H, Zheng H, et al. Hepatic inflammation scores correlate with common carotid intima-media thickness in rats with NAFLD induced by a high-fat diet. BMC Vet Res 2014;10:162. [DOI] [PMC free article] [PubMed] [Google Scholar]
- [22].Browning JD, Horton JD. Molecular mediators of hepatic steatosis and liver injury. J Clin Invest 2004;114:147–52. [DOI] [PMC free article] [PubMed] [Google Scholar]
- [23].Tilg H, Moschen AR. Evolution of inflammation in nonalcoholic fatty liver disease: the multiple parallel hits hypothesis. Hepatology 2010;52:1836–46. [DOI] [PubMed] [Google Scholar]
- [24].Tsuchiya A, Lu WY, Weinhold B, et al. Polysialic acid/neural cell adhesion molecule modulates the formation of ductular reactions in liver injury. Hepatology 2014;60:1727–40. [DOI] [PubMed] [Google Scholar]
- [25].Sugiyama Y, Koike T, Shiojiri N. Developmental changes of cell adhesion molecule expression in the fetal mouse liver. Anat Rec (Hoboken) 2010;293:1698–710. [DOI] [PubMed] [Google Scholar]
- [26].Asselah T, Bièche I, Laurendeau I, et al. Liver gene expression signature of mild fibrosis in patients with chronic hepatitis C. Gastroenterology 2005;129:2064–75. [DOI] [PubMed] [Google Scholar]
- [27].Iizuka M, Ogawa T, Enomoto M, et al. Induction of microRNA-214-5p in human and rodent liver fibrosis. Fibrogenesis Tissue Repair 2012;5:12. [DOI] [PMC free article] [PubMed] [Google Scholar]
- [28].Zhao YP, Wang H, Fang M, et al. Study of the association between polymorphisms of the COL1A1 gene and HBV-related liver cirrhosis in Chinese patients. Dig Dis Sci 2009;54:369–76. [DOI] [PubMed] [Google Scholar]
- [29].Misawa K, Kanazawa T, Misawa Y, et al. Hypermethylation of collagen alpha2 (I) gene (COL1A2) is an independent predictor of survival in head and neck cancer. Cancer Biomark 2011;10:135–44. [DOI] [PubMed] [Google Scholar]
- [30].Wang W, Wu Q, Cao L, et al. Mutation analysis of COL1A1 and COL1A2 in fetuses with osteogenesis imperfecta type II/III. Gynecol Obstet Invest 2015;79: sgmppl =-109. [DOI] [PubMed] [Google Scholar]
- [31].Stephen J, Shukla A, Dalal A, et al. Mutation spectrum of COL1A1 and COL1A2 genes in Indian patients with osteogenesis imperfecta. Am J Med Genet A 2014;164A:1482–9. [DOI] [PubMed] [Google Scholar]
- [32].Flechtner-Mors M, Schick A, Oeztuerk S, et al. Associations of fatty liver disease and other factors affecting serum SHBG concentrations: a population based study on 1657 subjects. Horm Metab Res 2013;46:287–93. [DOI] [PubMed] [Google Scholar]
- [33].Stefan N, Häring H-U. The metabolically benign and malignant fatty liver. Diabetes 2011;60:2011–7. [DOI] [PMC free article] [PubMed] [Google Scholar]
- [34].Tsukamoto S, Shimada K, Honoki K, et al. Ubiquilin 2 enhances osteosarcoma progression through resistance to hypoxic stress. Oncol Rep 2015;33:1799–806. [DOI] [PubMed] [Google Scholar]
- [35].El Ayadi A, Stieren ES, Barral JM, et al. Ubiquilin-1 and protein quality control in Alzheimer disease. Prion 2013;7:164–9. [DOI] [PMC free article] [PubMed] [Google Scholar]
- [36].Daoud H, Rouleau GA. A role for ubiquilin 2 mutations in neurodegeneration. Nature Rev Neurol 2011;7:599–600. [DOI] [PubMed] [Google Scholar]
- [37].Matsuda M, Koide T, Yorihuzi T, et al. Molecular cloning of a novel ubiquitin-like protein, UBIN, that binds to ER targeting signal sequences. Biochem Biophys Res Commun 2001;280:535–40. [DOI] [PubMed] [Google Scholar]
- [38].Kraus C, Liehr T, Hülsken J, et al. Localization of the human (-catenin gene (CTNNB1) to 3p21: a region implicated in tumor development. Genomics 1994;23:272–4. [DOI] [PubMed] [Google Scholar]
- [39].Nault JC, Fabre M, Couchy G, et al. GNAS-activating mutations define a rare subgroup of inflammatory liver tumors characterized by STAT3 activation. J Hepatol 2012;56:184–91. [DOI] [PubMed] [Google Scholar]
- [40].Van Broekhoven DL, Verhoef C, Grunhagen DJ, et al. Prognostic value of CTNNB1 gene mutation in primary sporadic aggressive fibromatosis. Ann Surg Oncol 2015;22:1464–70. [DOI] [PubMed] [Google Scholar]
- [41].Ozen C, Yildiz G, Dagcan AT, et al. Genetics and epigenetics of liver cancer. New Biotechnol 2013;30:381–4. [DOI] [PubMed] [Google Scholar]
- [42].Kubota Y, Kawakami H, Natsuizaka M, et al. CTNNB1 mutational analysis of solid-pseudopapillary neoplasms of the pancreas using endoscopic ultrasound-guided fine-needle aspiration and next-generation deep sequencing. J Gastroenterol 2015;50:203–10. [DOI] [PubMed] [Google Scholar]
Associated Data
This section collects any data citations, data availability statements, or supplementary materials included in this article.


