
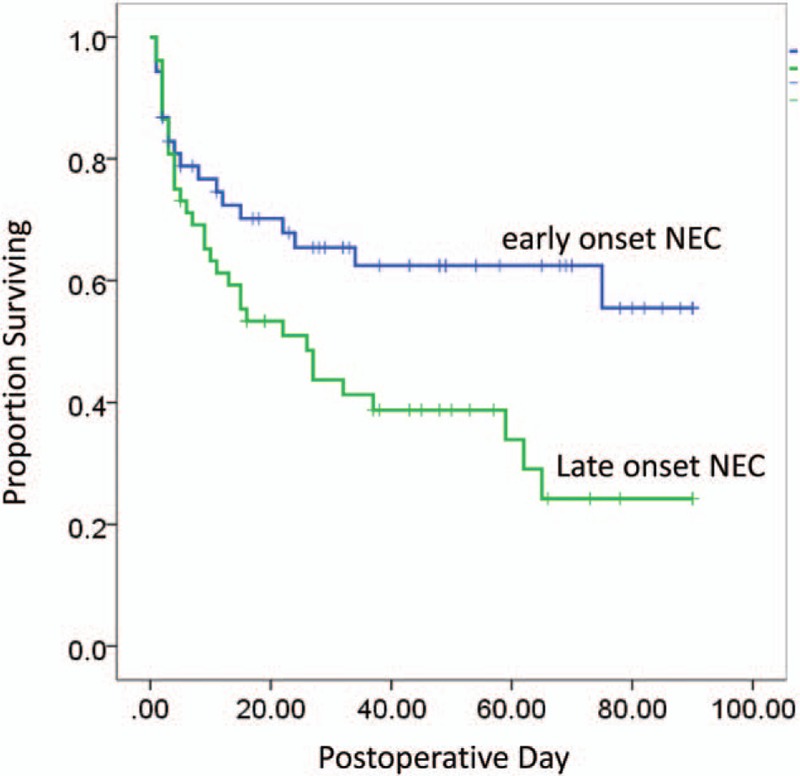
Figure 1.
Kaplan–Meier survival curves for the infants with early and late-onset NEC. Survival curves were compared with the use of the log-rank test (P = .015).
Official websites use .gov
A
.gov website belongs to an official
government organization in the United States.
Secure .gov websites use HTTPS
A lock (
) or https:// means you've safely
connected to the .gov website. Share sensitive
information only on official, secure websites.
Kaplan–Meier survival curves for the infants with early and late-onset NEC. Survival curves were compared with the use of the log-rank test (P = .015).